Stock gapping
What exactly is a gap in a price chart?
A gap is a break in the price chart of a security, which occurs when the price suddenly rises or falls sharply, causing certain price levels to be skipped so that no trading takes place at those levels. This results in a "gap" on the price chart, where the price bars initially do not overlap as in normal trading.
How do gaps occur?
Gaps can occur for a variety of reasons, including the announcement of important news or information, whether or not directly related to the stock in which the gap occurs. More commonly, a change in underlying market sentiment can also cause gaps to occur in indexes, ETFs or individual stocks.
Whatever the reason, gaps arise because there is a sudden sharp increase in trading that causes the price of a security to rise or fall rapidly, resulting in a gap.
A gap up is when the price suddenly rises extremely, this is a bullish scenario. A gap down is bearish and occurs when the price suddenly opens noticeably lower than the previous close on the price bar.
Types of gaps
Four main types can be distinguished; the regular, breakaway, runaway and exhaustion gap.
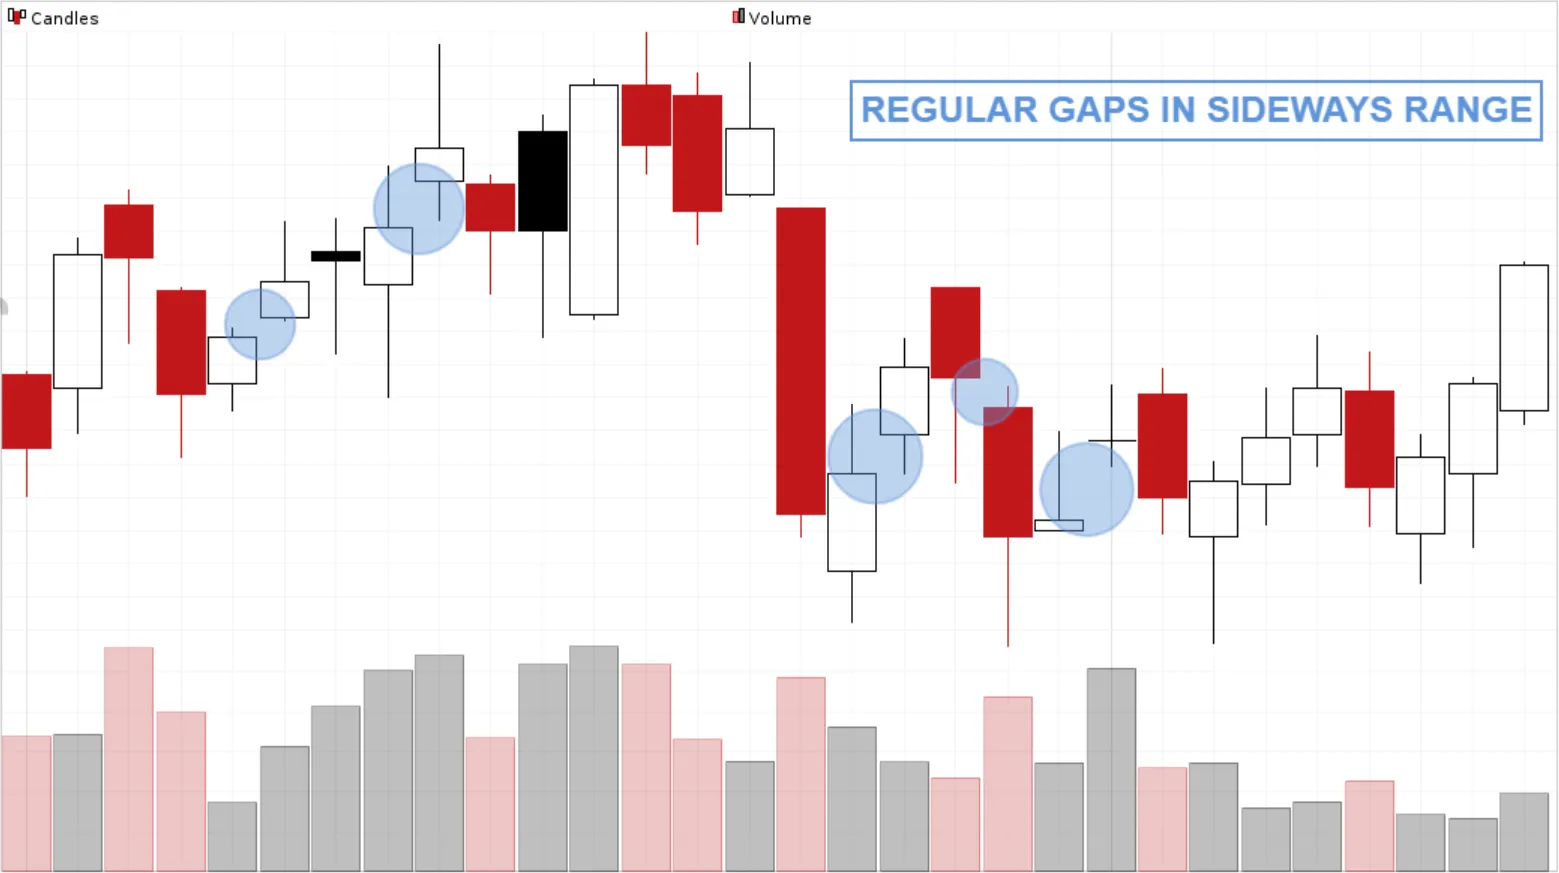
- Regular gaps are the most common type of gap and occur during the normal price action of a stock, usually during a somewhat trendless period. These gaps are usually not very significant and do not have a major impact on the overall trend of the stock.
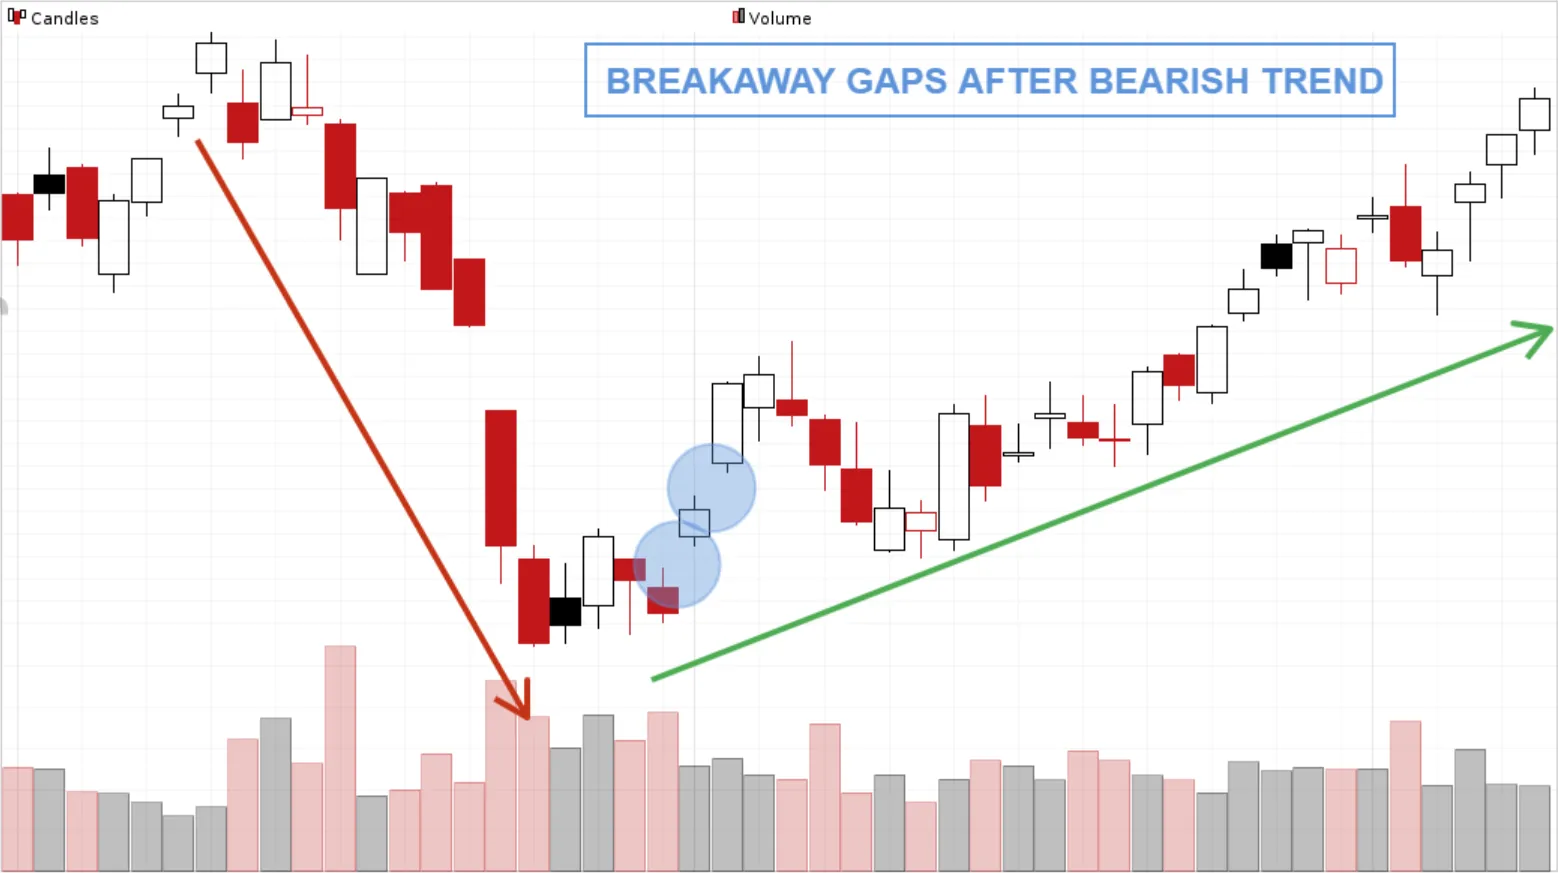
- Breakaway gaps occur at the beginning of a new trend and indicate a potential change in the stock's price direction. For example, a breakaway gap which is part of a reversal pattern after a falling trend can indicate that the price will undergo a trend change.
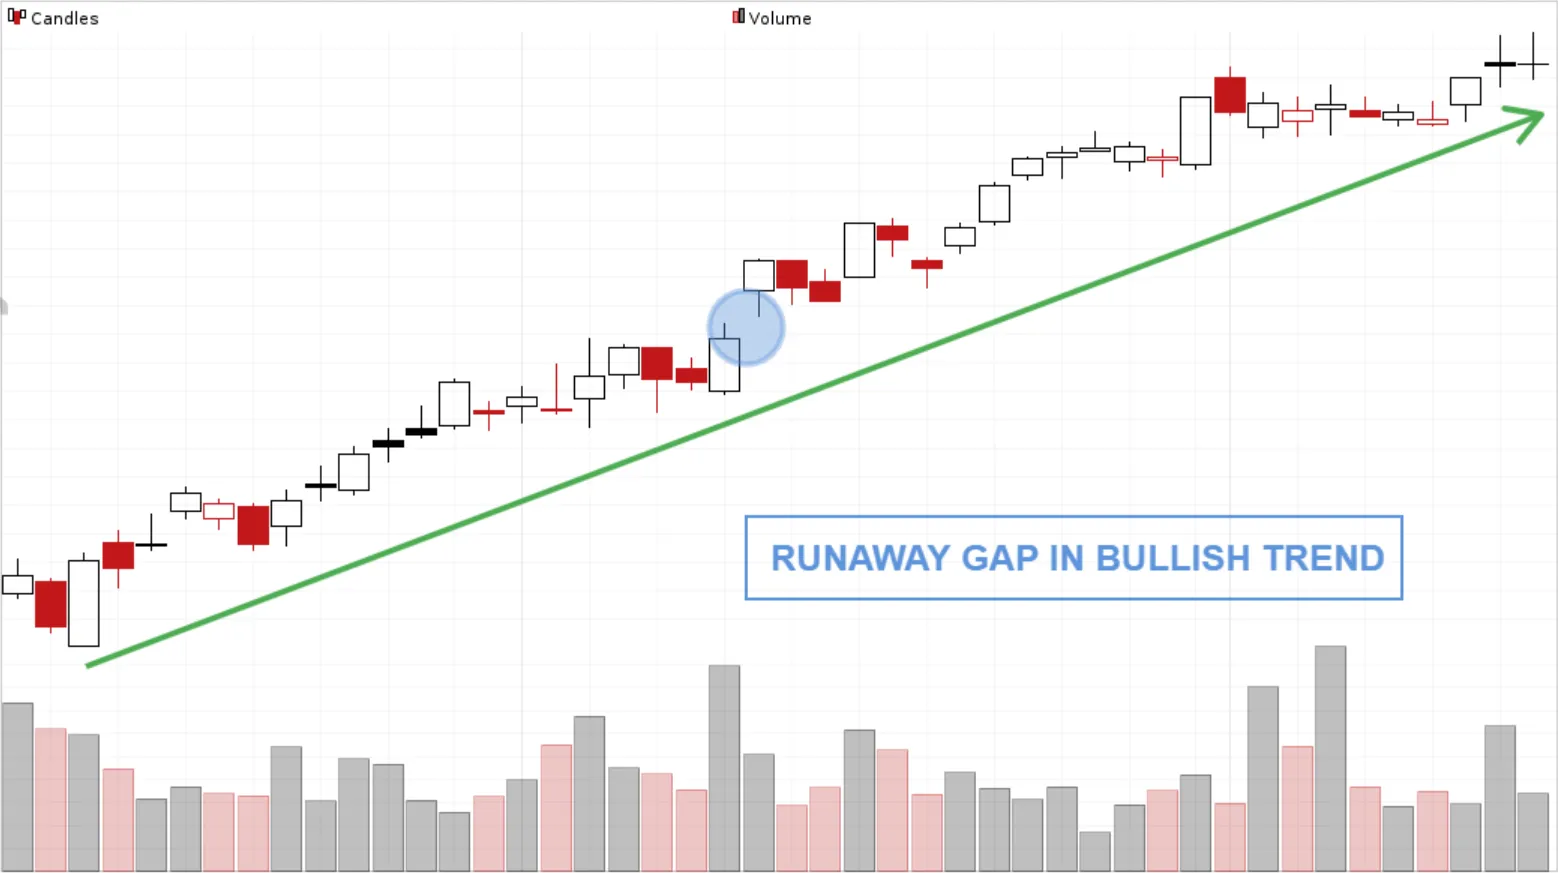
- Runaway gaps occur during an existing trend and indicate a continuation of that trend. For example, a runaway gap during an uptrend can indicate that price is likely to continue moving higher. These gaps are usually accompanied by greatly increased momentum.
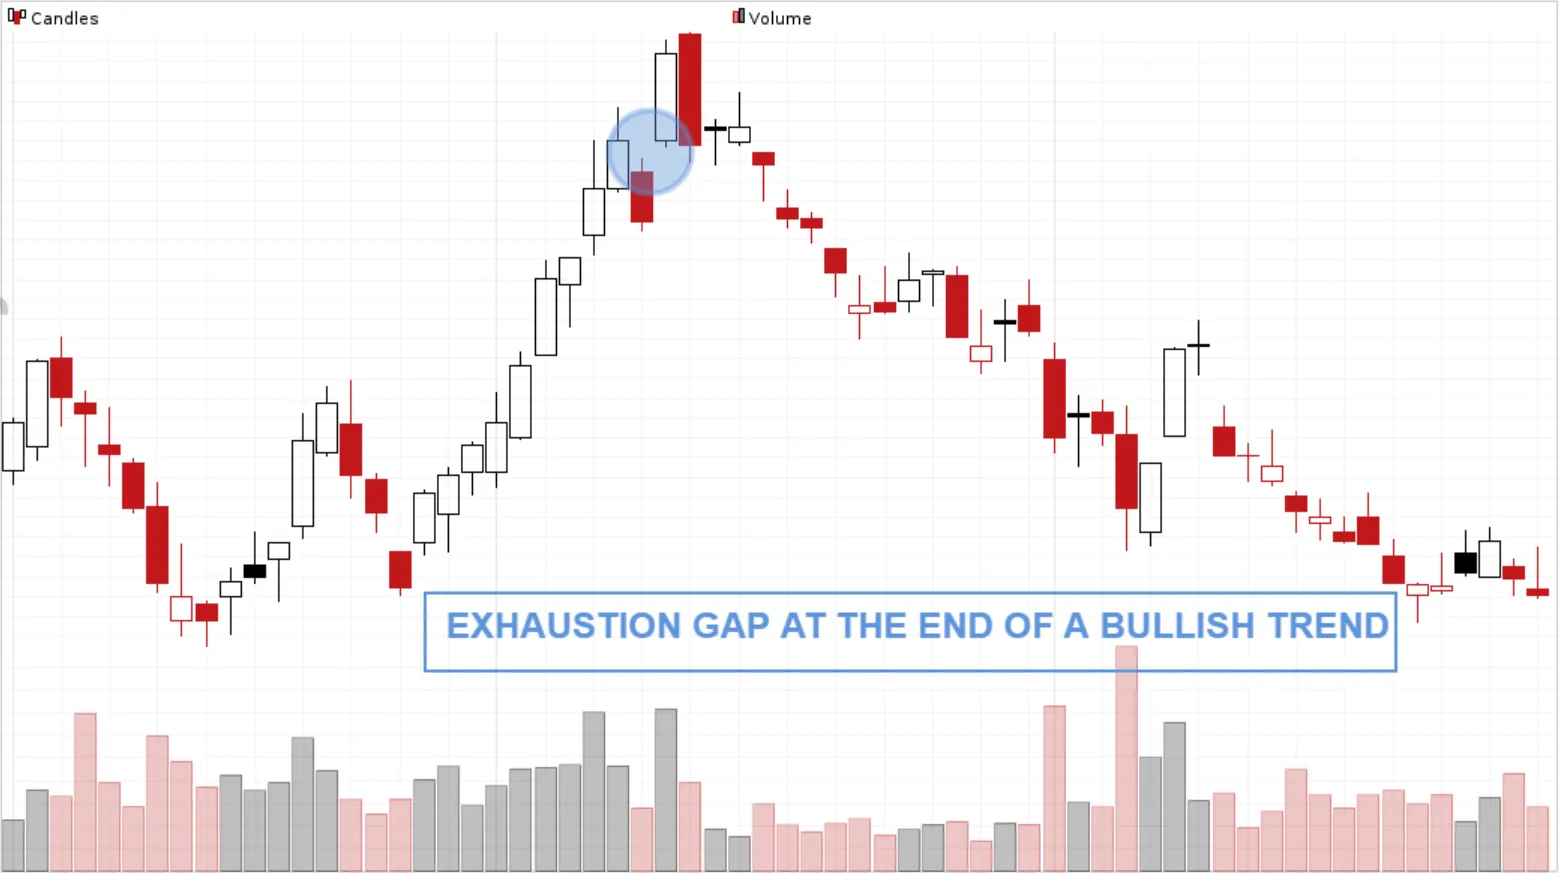
- Exhaustion gaps are initially runaway gaps. The major difference is that the gap is closed very quickly. For example, after a strong price rise, there may be a sudden gap caused by buyers who missed the initial rise and still buy (in panic) because they fear they will miss the big move otherwise.... If this gap occurs near a clear resistance level and the gap is quickly filled there may be an exhaustion gap. This is a negative signal and possibly the harbinger of a further price decline.
What's the difference between a full gap vs a partial gap?
We already know that a gap is nothing but a change in the price level between the close and the opening of two consecutive days (or hours/minutes if you are using intraday charts).
- A full gap occurs when the opening price exceeds the previous day's high.
- A partial gap occurs when today's opening price is higher than yesterday's closing price, but not higher than yesterday's high.
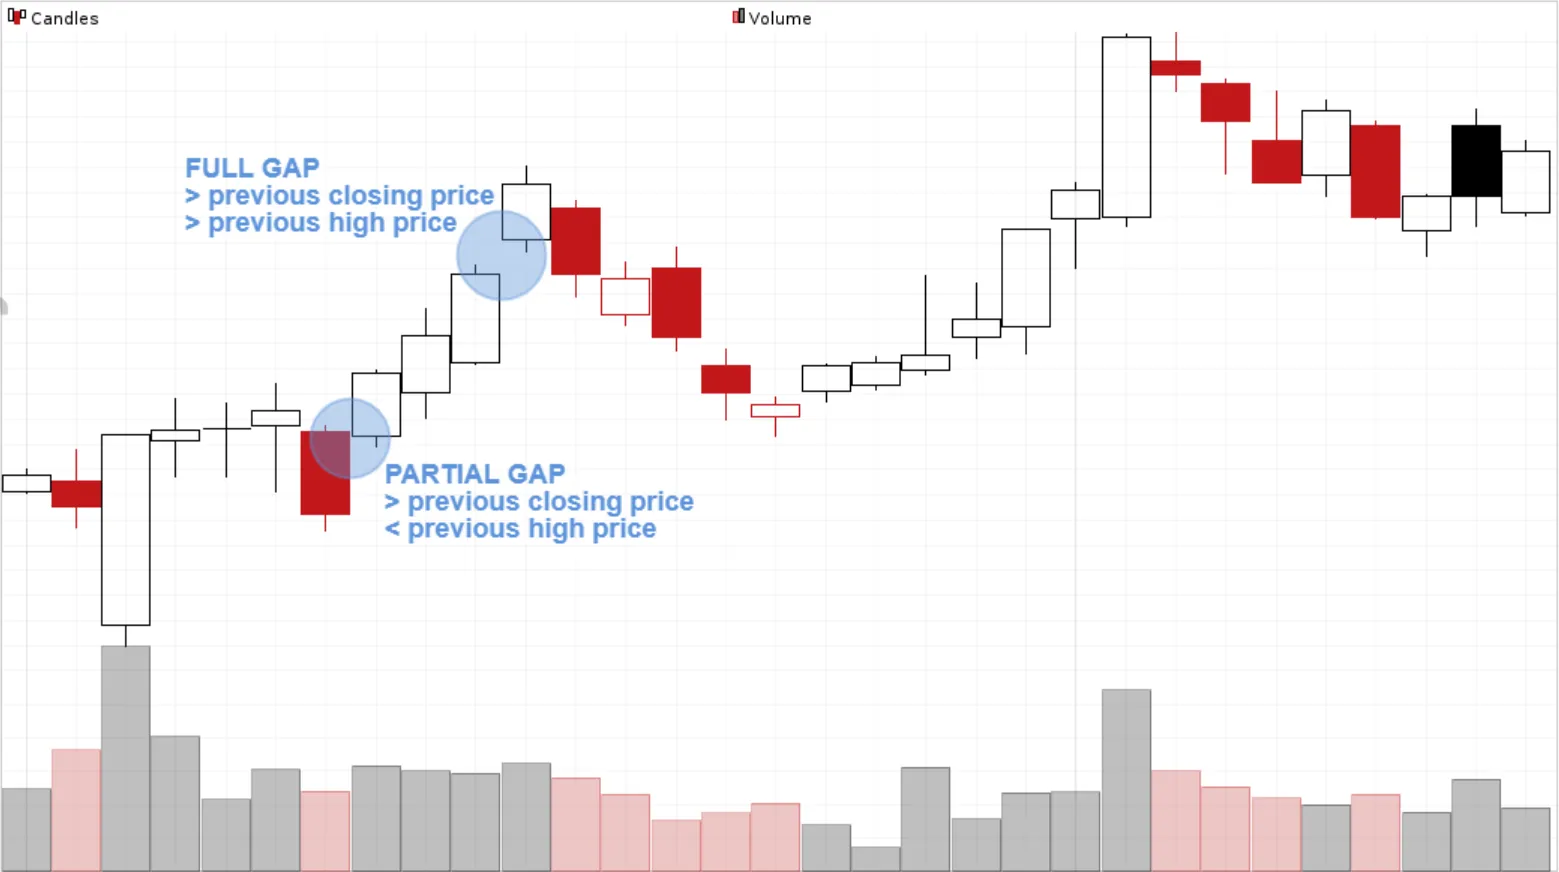
Full gaps are considered to be stronger and thus more relevant than partial gaps. Full gaps usually occur when there is strong upward momentum.
How are gaps used in trading?
Traders can use gaps in their technical analysis to identify potential trading opportunities or as warning signals to protect or even close open positions. For example, a trader who sees a breakaway gap on the price chart of a security may consider taking a long position (i.e., buying the security) on the assumption that he may be dealing with a new uptrend. The breakaway gap usually allows a short stoploss to be placed.
On the other hand, a trader who sees a runaway gap on the price chart of a security can take advantage of the momentum and maintain or even extend the current long position, speculating on the continuation of the existing uptrend.
Gaps that manifest themselves after a strong trend are possibly exhaustion gaps, which are the harbinger of an imminent top or bottom. These are warning signals. When an exhaustion gap is filled it is a signal for traders to close existing open positions in the direction of the existing trend or at least raise the stoploss.
Finding gap stocks using ChartMill
In our stock screener, you can easily use a filter to detect bullish or bearish gaps that occurred during the past trading day. More information in this article: "Finding Gap Stocks with the Stock Screener"
Summarized
- Gaps are breaks in a price chart and they occur when the price of a security suddenly rises or falls very rapidly.
- A distinction is made between regular gaps, breakaway gaps, runaway gaps and exhaustion gaps, each with their specific characteristics.
- A full gap opens above the previous day's high, a partial gap opens above the previous trading day's closing price.
- Gaps offer technical traders trading opportunities; the exhaustion gap can also be used as a warning to close or better protect open positions.
- Gaps by themselves are not sufficiently reliable and should always be used in conjunction with other relevant information to arrive at a complete trading strategy.