
How to use the Awesome Oscillator?
Introduction
This technical indicator was created by technical analyst Bill Williams, one of the most famous American financial analysts of the second half of the 20th century. The awesome oscillator is a momentum indicator that provides insight into how strong or how weak a stock is performing. This is done by comparing the recent market momentum with the more general momentum over a longer period in the past. This confirms existing trends or can be used to anticipate changes in trends.
Calculation
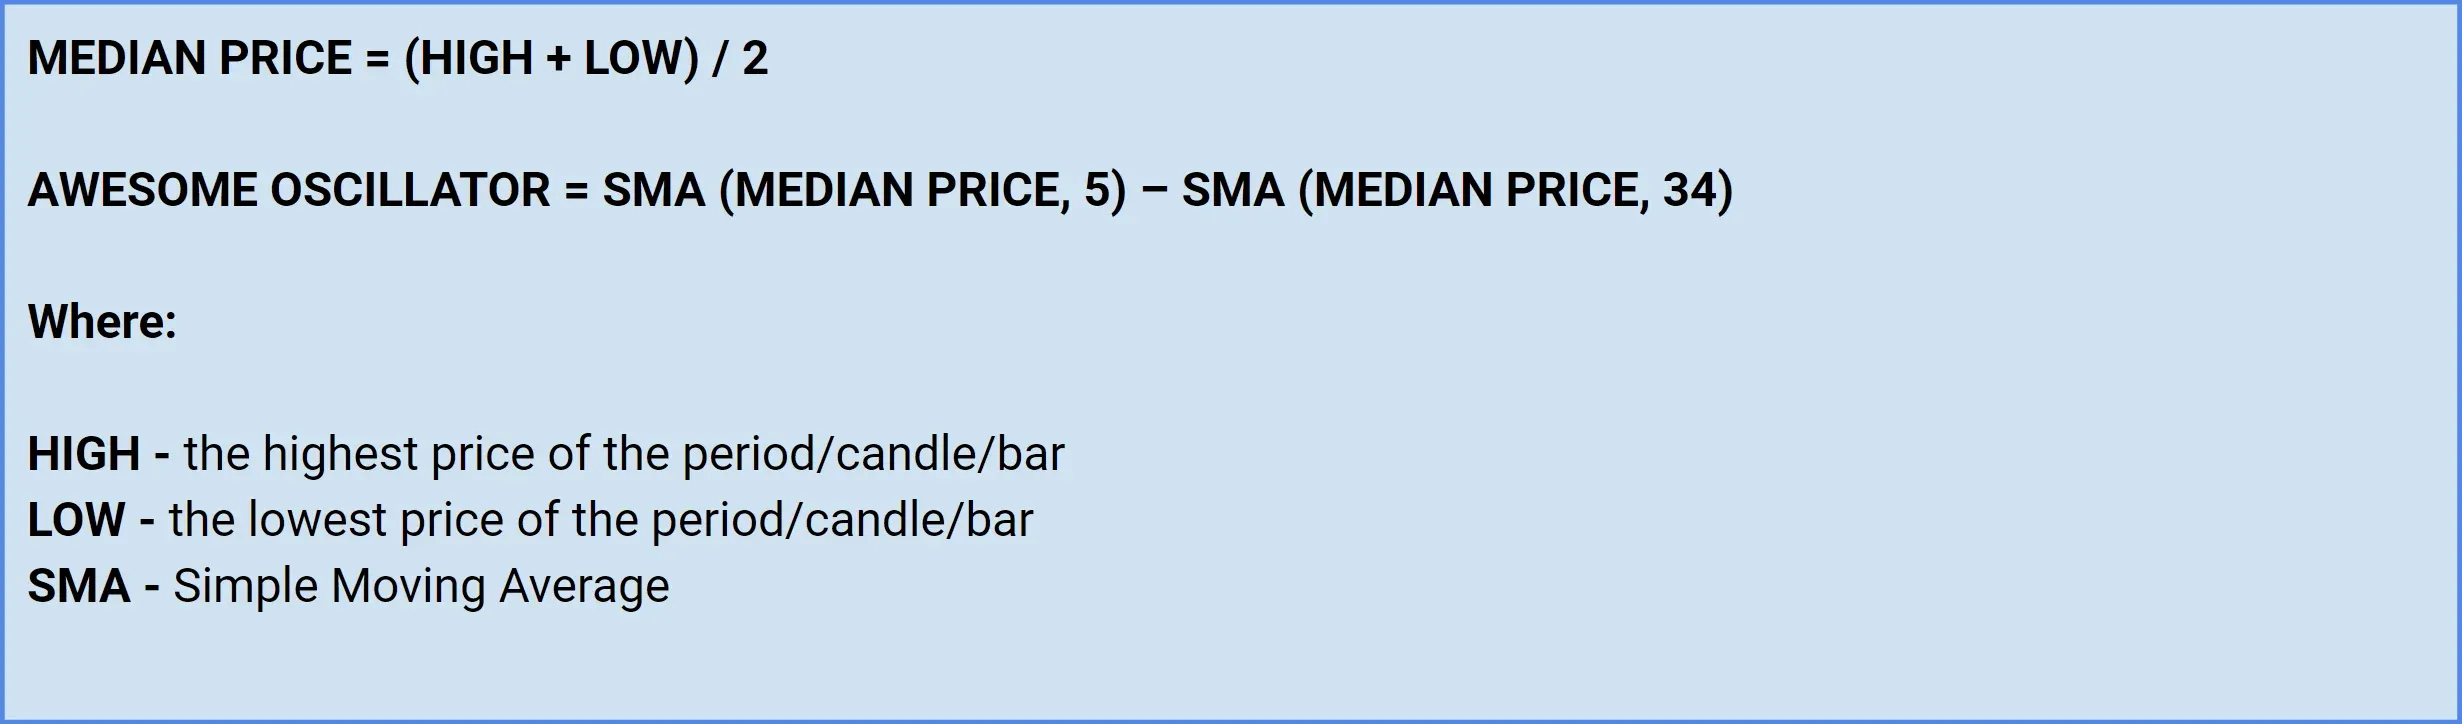
The Awesome Oscillator calculates the difference of a 34 with a 5-day simple moving average. In contrast to many other indicators that use moving averages, the calculation here is not based on closing prices but rather on the middle price of each period (high + low)/2.
This results in the following formula:
Interpretation of the values
- The obtained readings of the Awesome Oscillator are shown as green and red bars in a histogram which are above or below the zero line.
- A red bar is formed if the value of this bar is lower than the previous bar in the histogram.
- A green bar appears when the value of this bar exceeds the previous bar in the histogram.
- Values higher than zero indicate an upward price movement, the short-term momentum is higher than the long-term momentum.
- Values below zero indicate a downward trend, short-term momentum is lower than long-term momentum.
Buy and sell signals
Crossing of the zero line
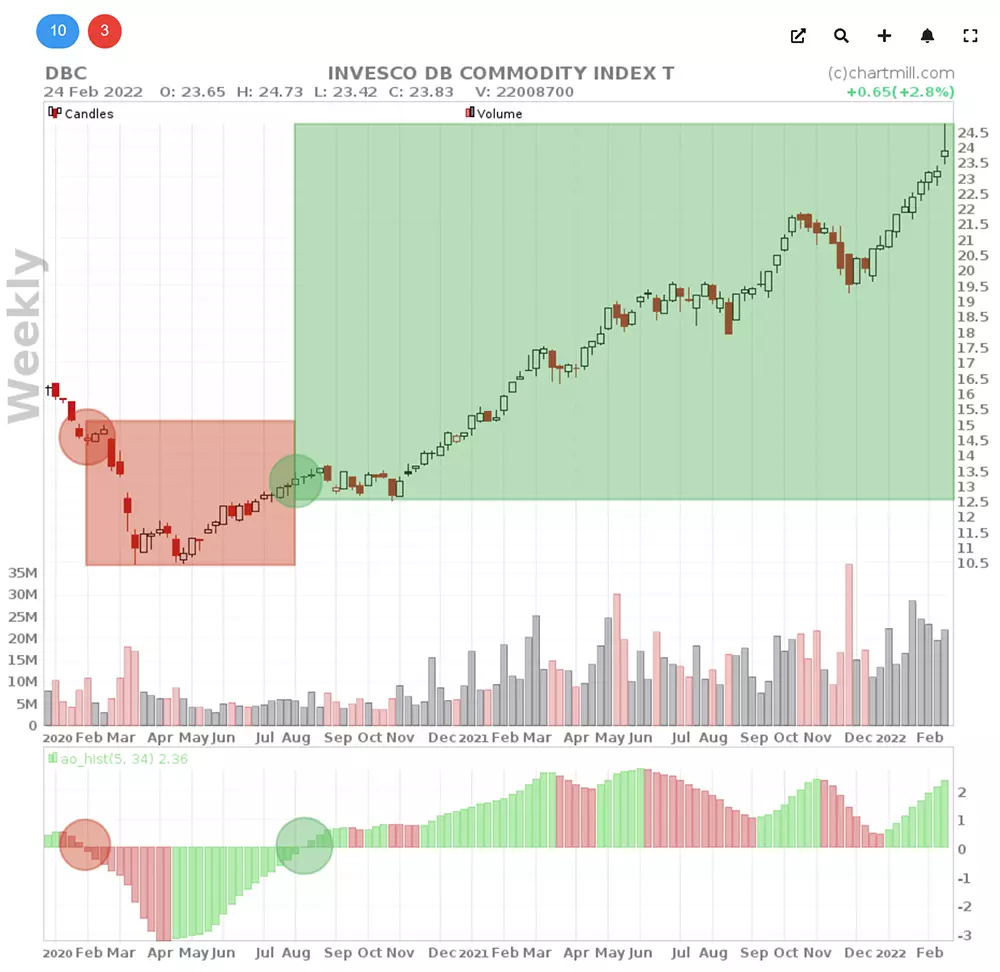
Crossings above and below the zero line should be interpreted as confirmation signals. In the chart below we have indicated two points. The green circle shows an upward crossing of the zero line indicating that the price is rising and buyers are gaining the upper hand. The red circle is a downward cross of the zero line, a warning that sellers are on top.
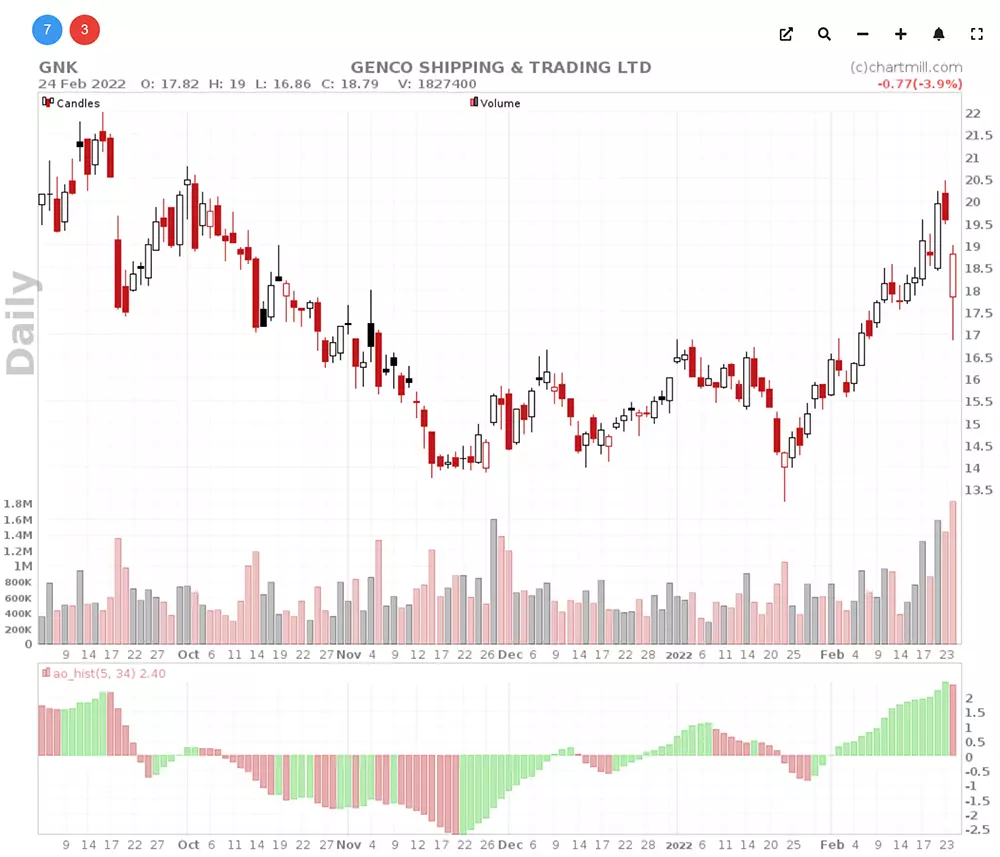
However, do not make the mistake of simply buying or selling at a cross above or below the zero line. Contrary to what the chart above suggests, the chances of false signals are quite high. Take a look at the chart below where the price of the stock does not show a distinct trend at any time, so the up and down crosses follow each other in rapid succession.
If you had gone long or short for this stock each time based on the crossing of the zero line, just about all signals would have resulted in losses.
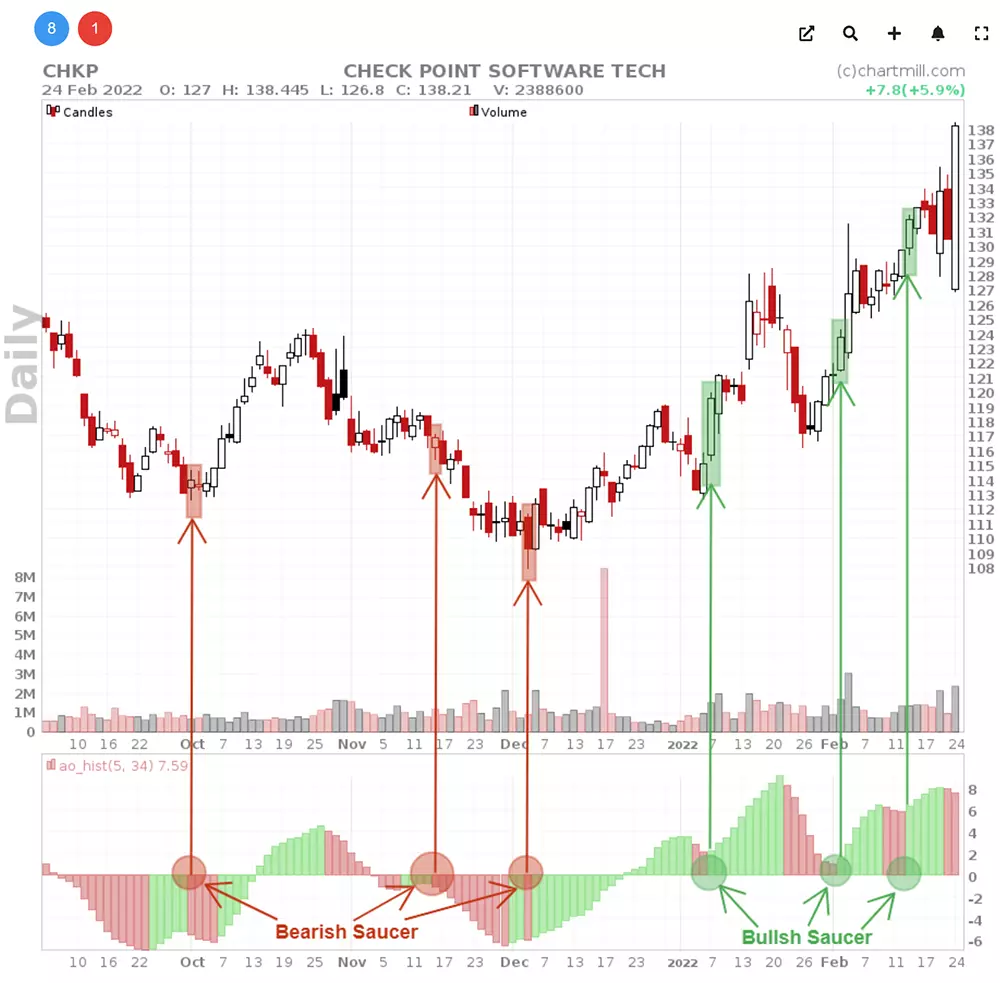
The Saucer Method.
This method is used to identify interim retracements in a bullish or bearish trend and enter a position in the direction of the existing trend.
Saucer Bullish entry conditions
- The value of the oscillator is above the zero line
- A peak of green consecutive bars is visible
- At least two consecutive red bars (with the second bar being lower than the first) are followed by another green bar
Saucer Bearish entry conditions
- The value of the oscillator is below the zero line
- A bottom is visible of red consecutive bars
- At least two consecutive green bars follow (where the second bar is higher than the first), followed by another red bar
Twin Peaks
Unlike the Saucer method, the Twin Peaks method looks for true reversal signals following a sequence of two price peaks or price bottoms. As the name implies, it comes down to identifying two peaks in momentum. The Twin Peaks entry is possible both as a bullish or bearish signal.
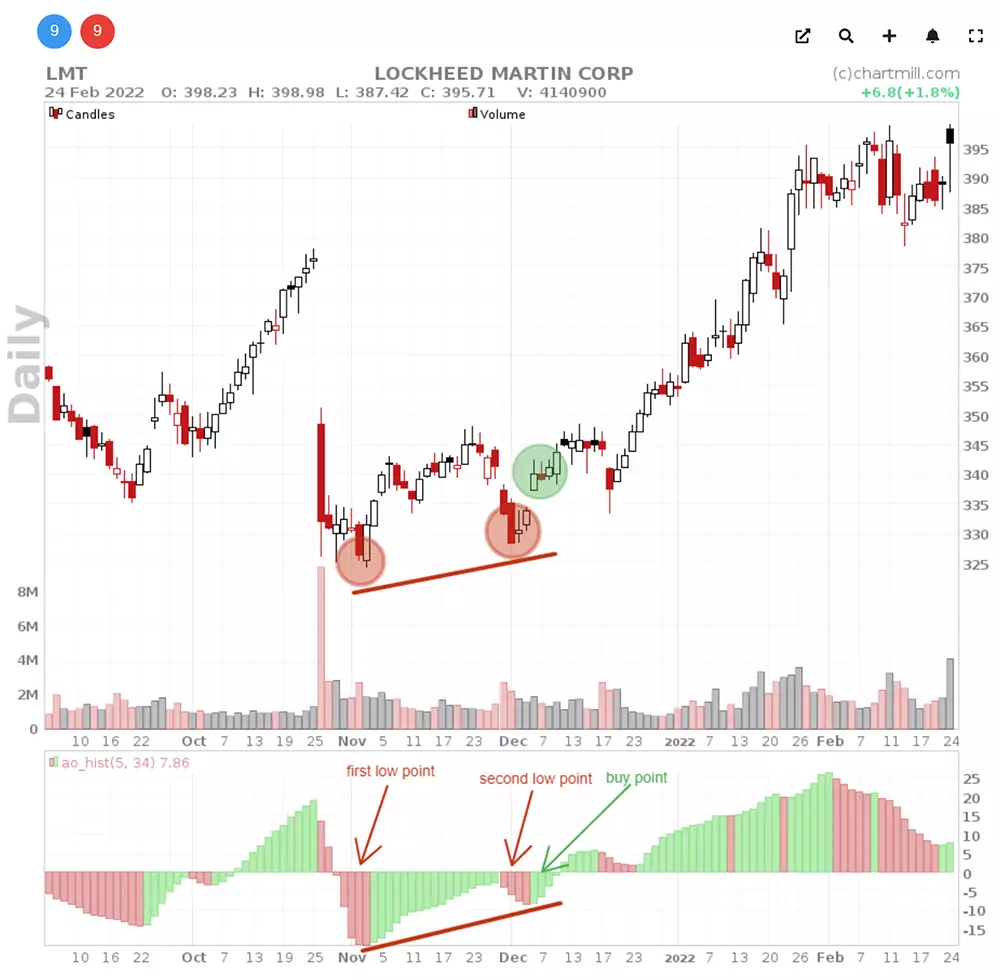
Twin Peaks Bullish entry conditions
- Two low points are visible in the indicator whereby the second low point is clearly higher than the first low point
- Between the two lows the value of the oscillator should not have exceeded the zero line
- The first green bar after the second low is the warning signal. The following day a long position can be considered based on this upward momentum
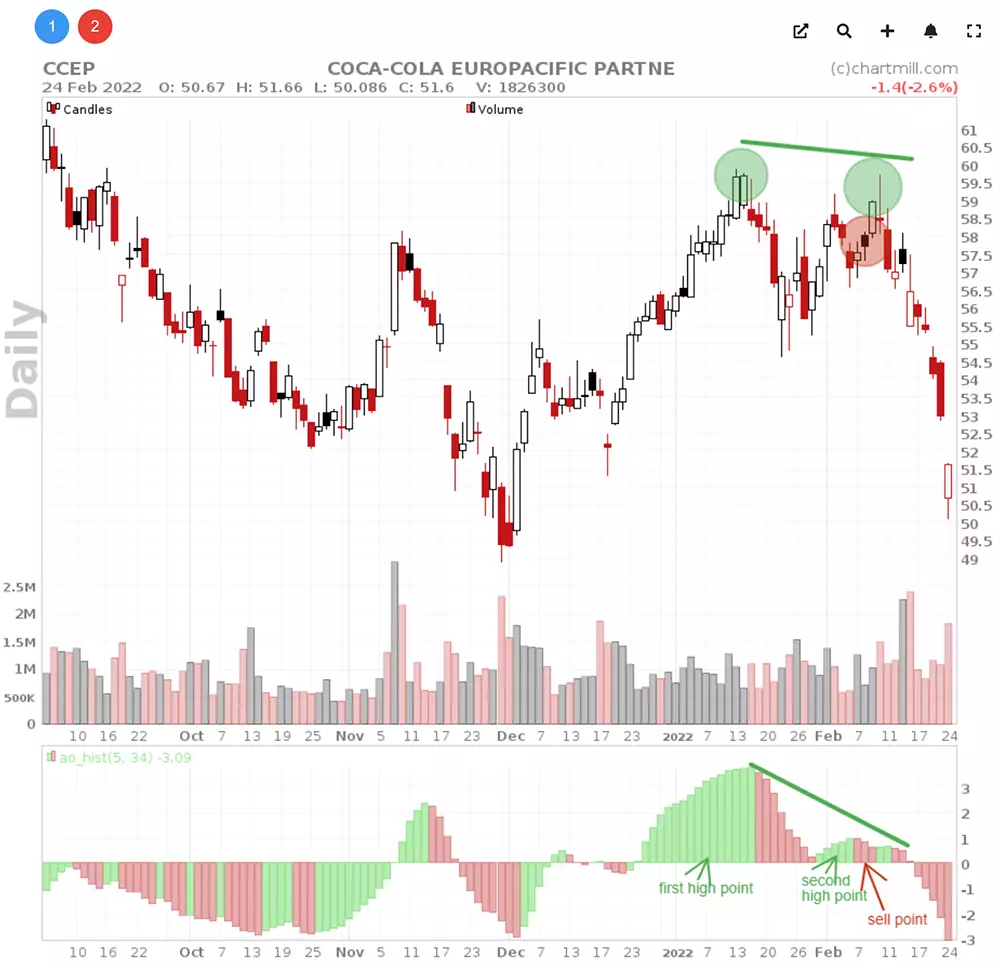
The conditions for a bearish twin peaks signal are just the opposite:
- Two highs are visible in the indicator where the second high is clearly lower than the first high
- Between the two highs, the value of the oscillator must not have fallen below the zero line
- The first red bar after the second high is the warning signal. A short position can be considered in the next period based on this downward momentum
Divergence signals
Finally, this Awesome Oscillator generates divergence signals (as is the case with the RSI or MACD indicator, for example).
A Bullish divergence signal occurs when price shows a lower bottom and the Awesome Oscillator shows a higher bottom. This can be a sign that the prevailing downward trend is losing strength and momentum, causing opportunities to arise on the buy side.
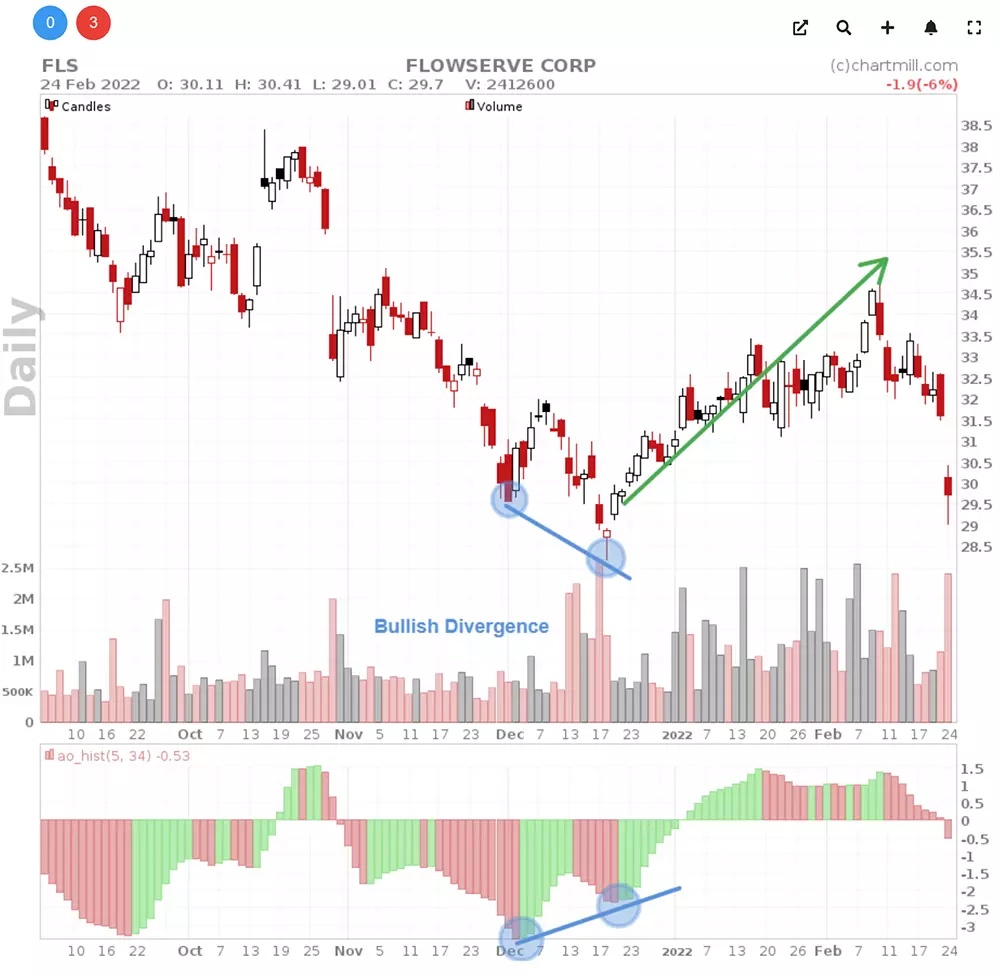
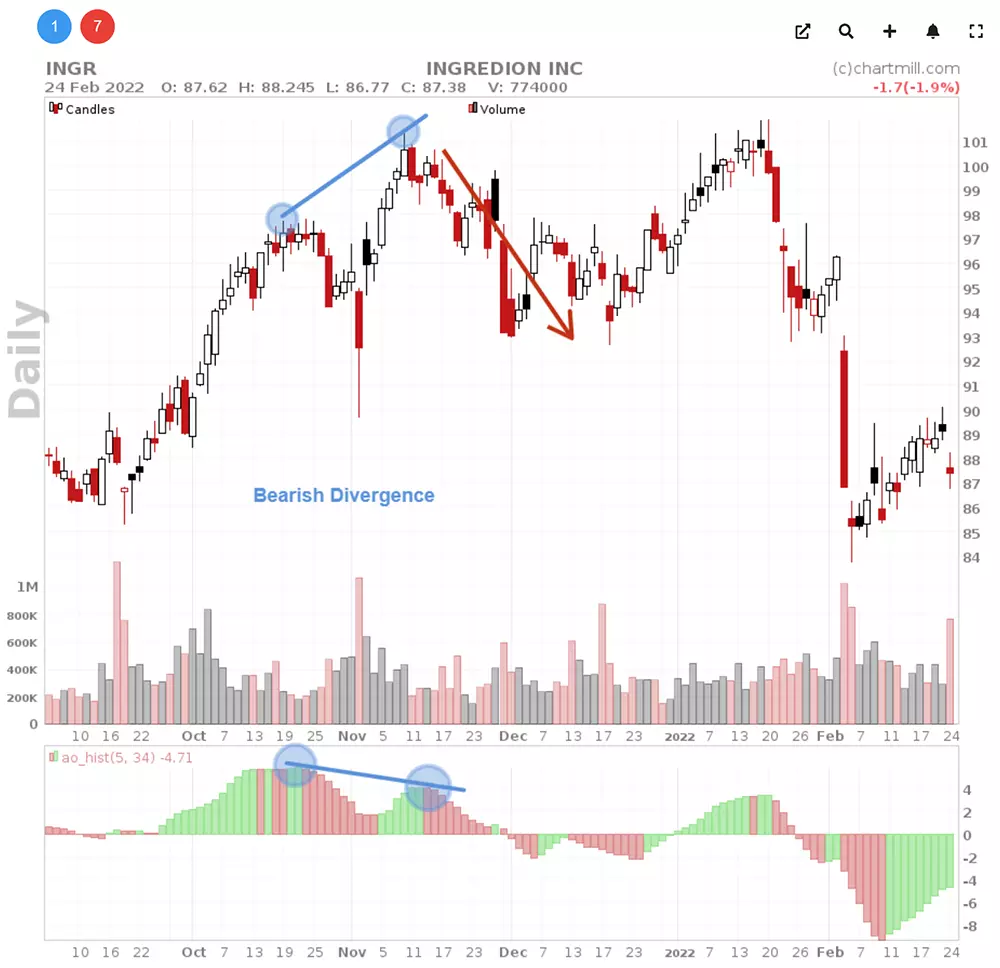
A Bearish divergence signal occurs when the price makes a higher top in contrast to the oscillator which shows a lower top. This can be a sign that the prevailing upward trend is losing strength and momentum, leading to opportunities on the sell side.
Important!
Just like in all of our other articles about the use of technical indicators, we need to emphasize that this Awesome Oscillator can't be used on its own to generate buy or sell signals. The accuracy of this indicator (or any other technical indicator for that matter) is simply not reliable enough.
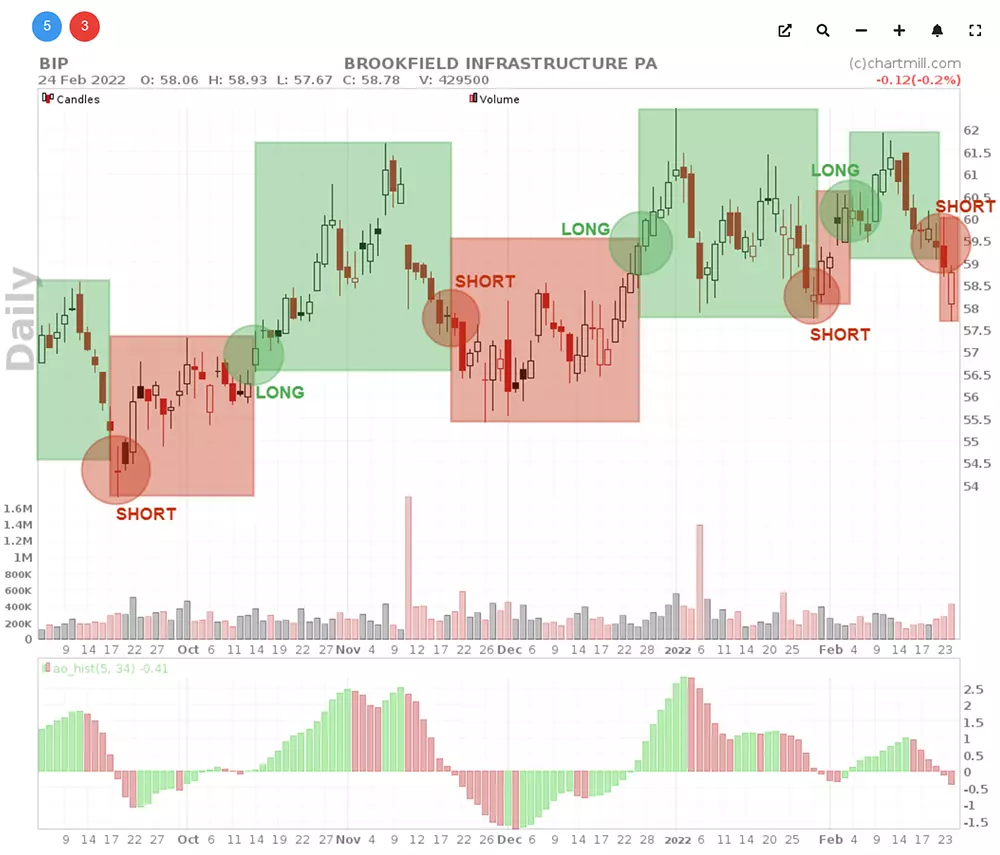
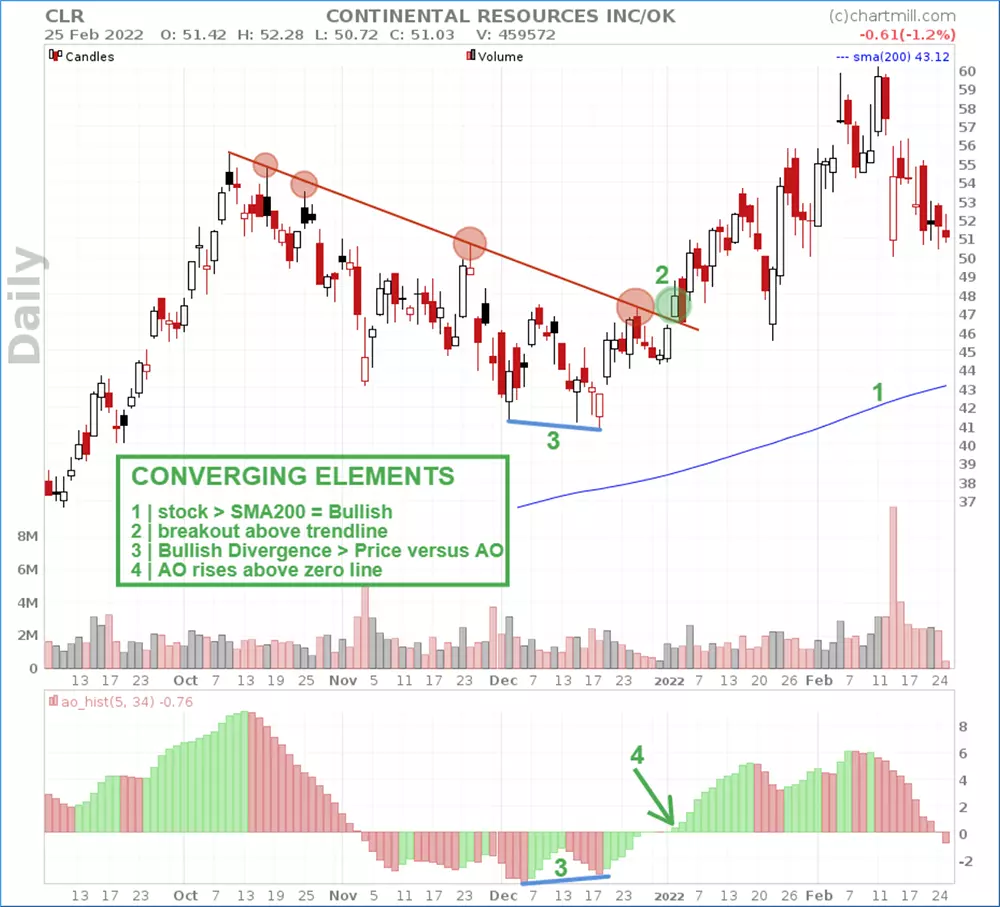
When analyzing possible buy opportunities you should - in addition to the mere long or short signal from this oscillator - look for as many converging elements as possible to support your setup.
What we mean exactly by this is shown in the example below where several elements are present together which makes the actual setup a lot more interesting to monitor.
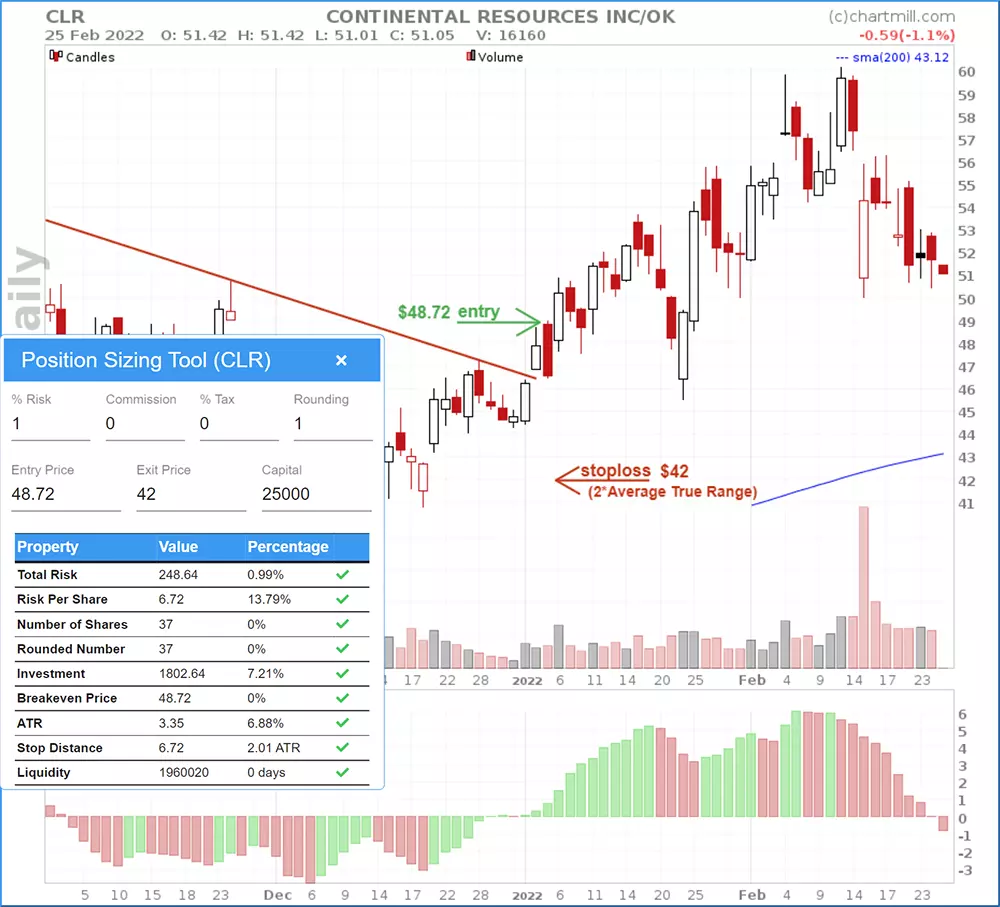
The actual trading setup, using the ChartMill Position Sizing Tool (PST):
We assume a trading account of $25,000 and a set risk rate of 1%. This means that a loss position can have a maximum loss of $250. We set the purchase price at $48.72 with a stoploss at $42. The distance to the stoploss is based on two times the current ATR value to avoid the position being stopped out too quickly during intraday movements. With these settings, the tool allows us to purchase exactly 37 shares.
Those who trade a little more aggressively might have placed the stoploss a little closer:
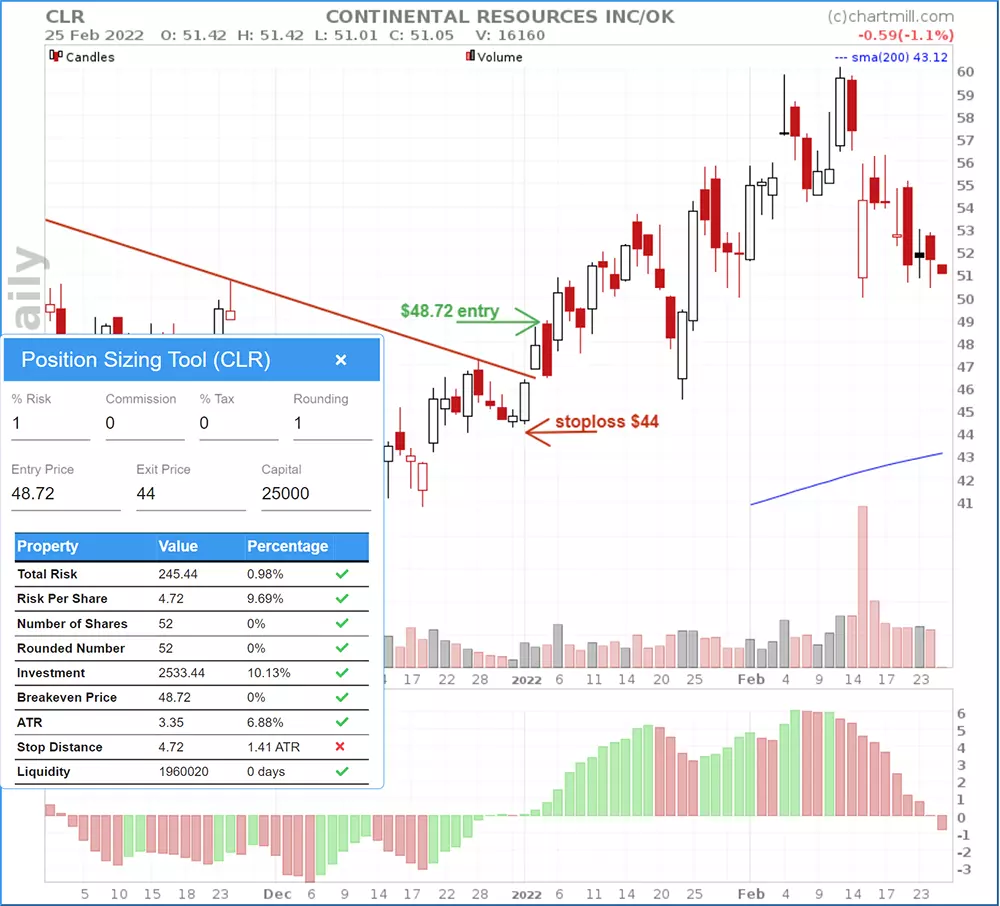
In this case, a stoploss below the last swinglow (+/- $42). Note how the PST tool does provide a warning in this case that the stop distance is only 1.4 times the ATR value.
Summary
The Awesome Oscillator is a versatile momentum indicator that can be used in multiple ways. However, always keep in mind that 100% accuracy is impossible and losing positions are just part of any trading strategy. Proceeding selectively and methodically, clearly delineating your risk in function of your available portfolio, will provide you with the very best chances of long-term success!