How to use the Awesome Indicator?
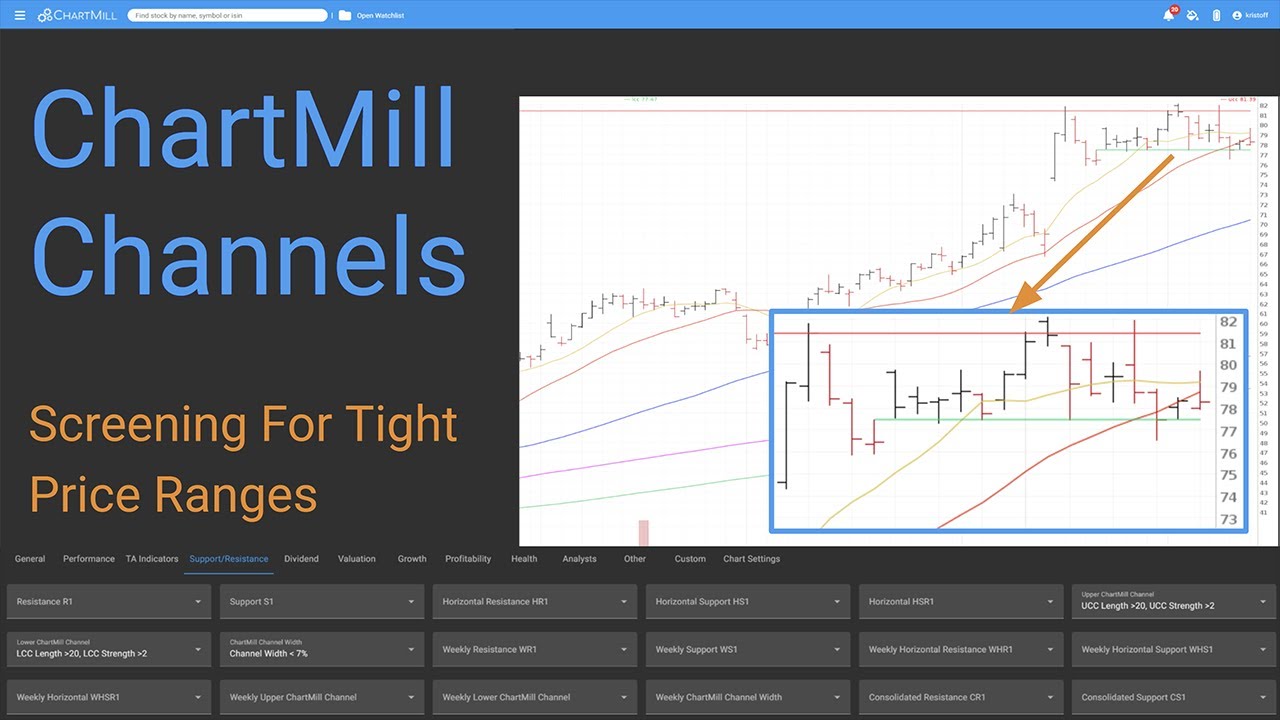
Screening For Tight Price Ranges | ChartMill Channels
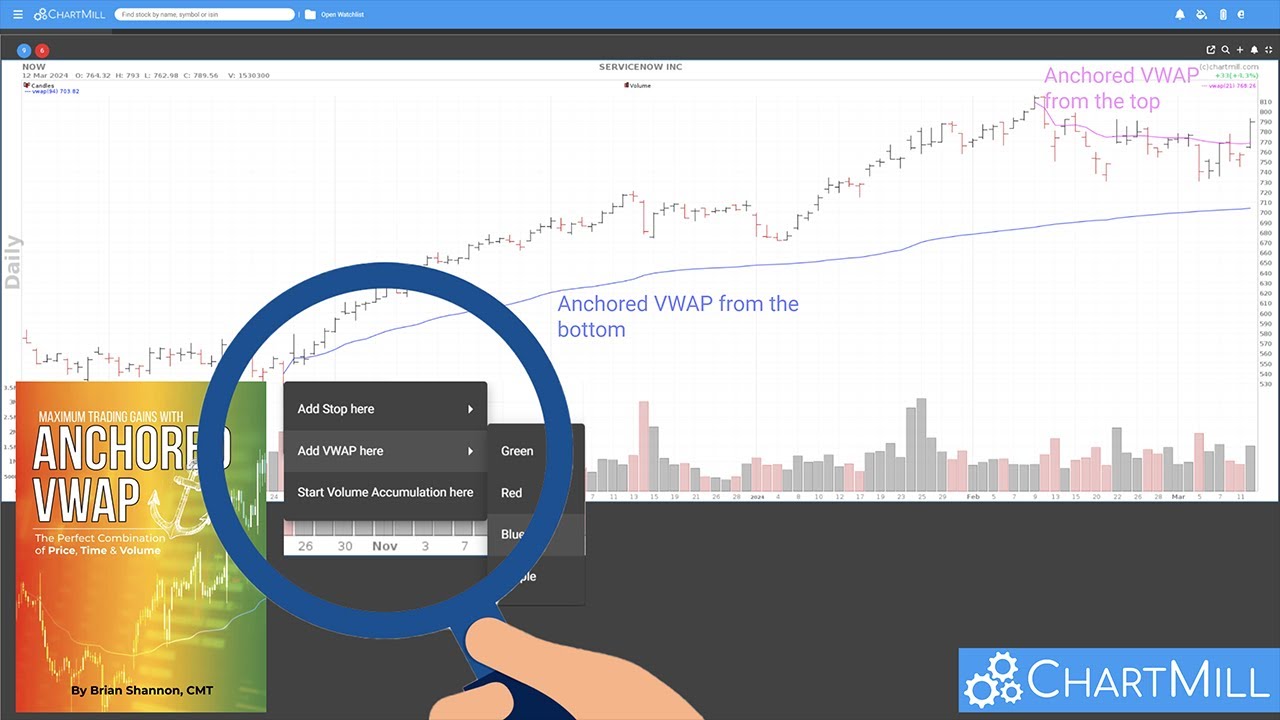
Adding an Anchored VWAP in ChartMill
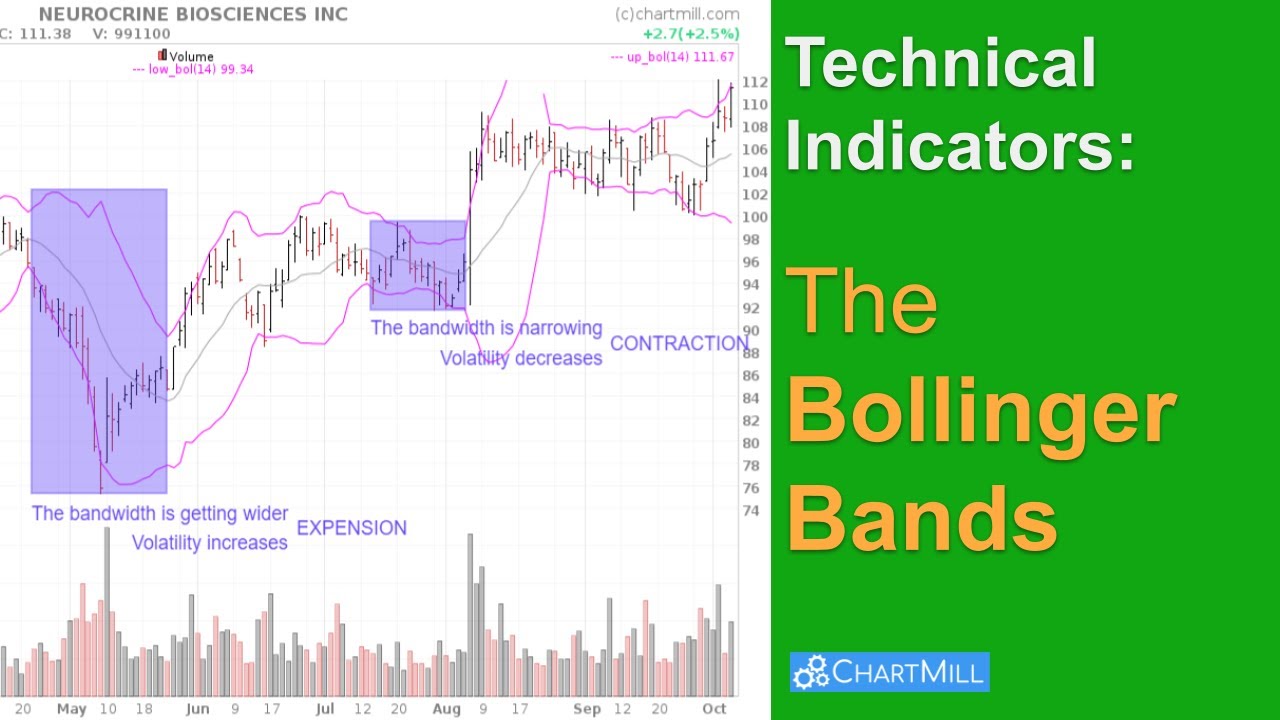
What are Bollinger Bands and how to use this indicator?

Bullish Engulfing Candlestick in Technical Analysis
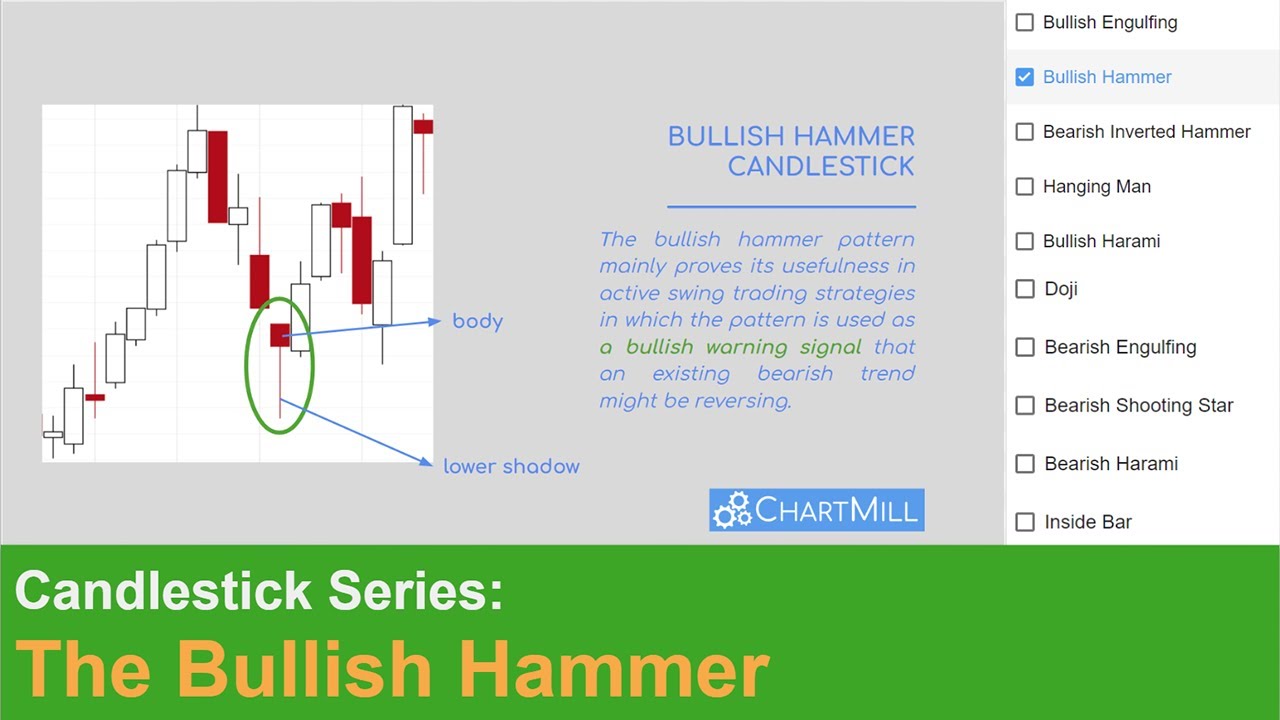
The Bullish Hammer Candlestick Pattern in Technichal Analysis
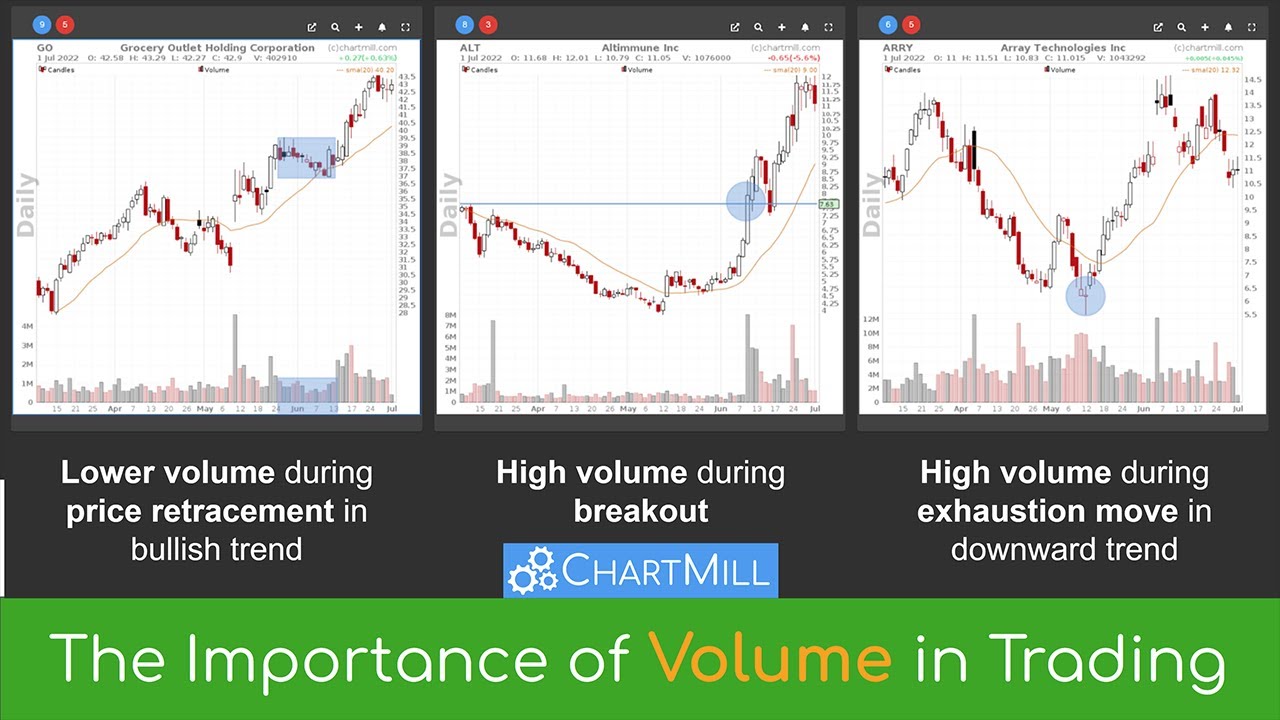
The Importance of Volume in trading (and why it matters!)
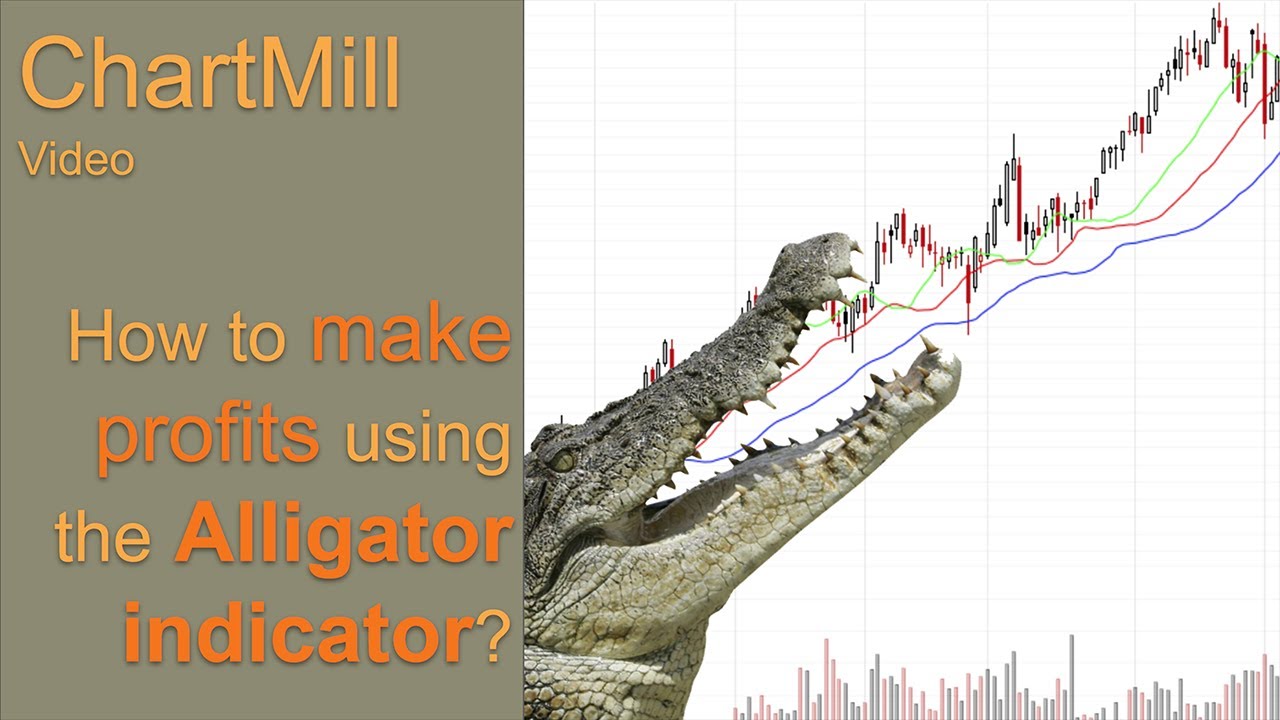
Alligator Indicator explained and trading strategy
How to use the Awesome Indicator?
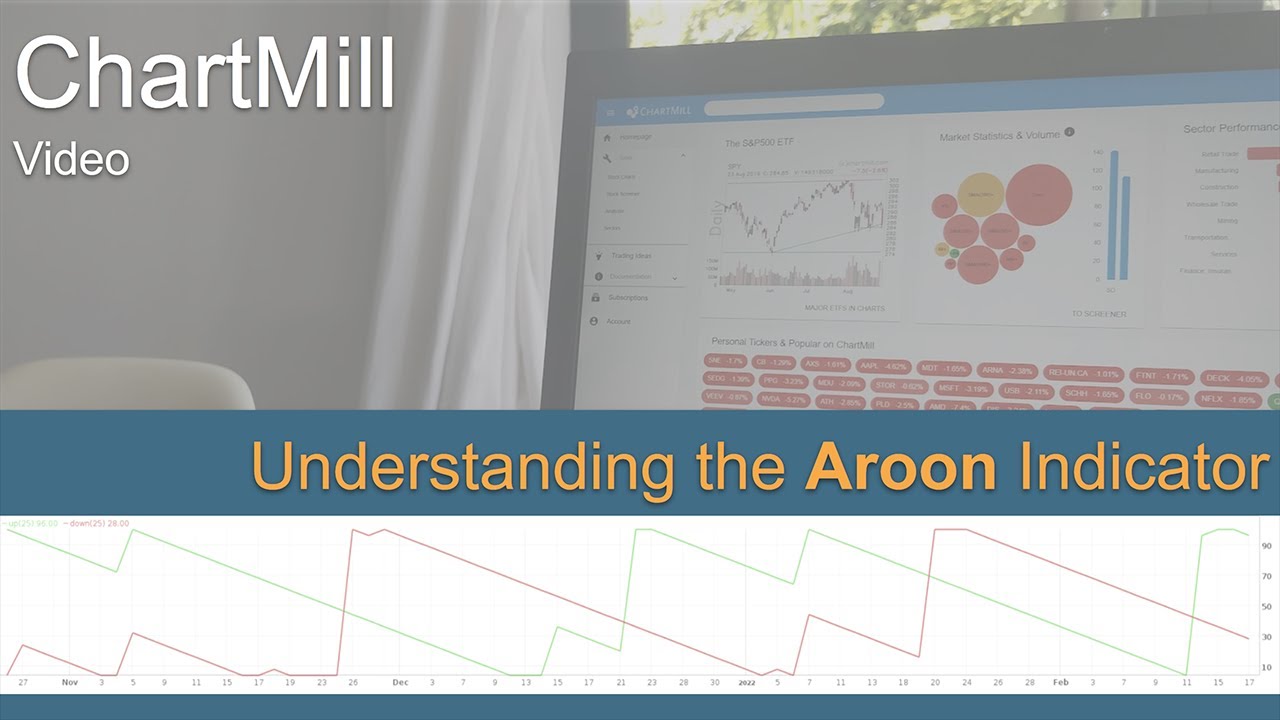
Understanding the Aroon indicator
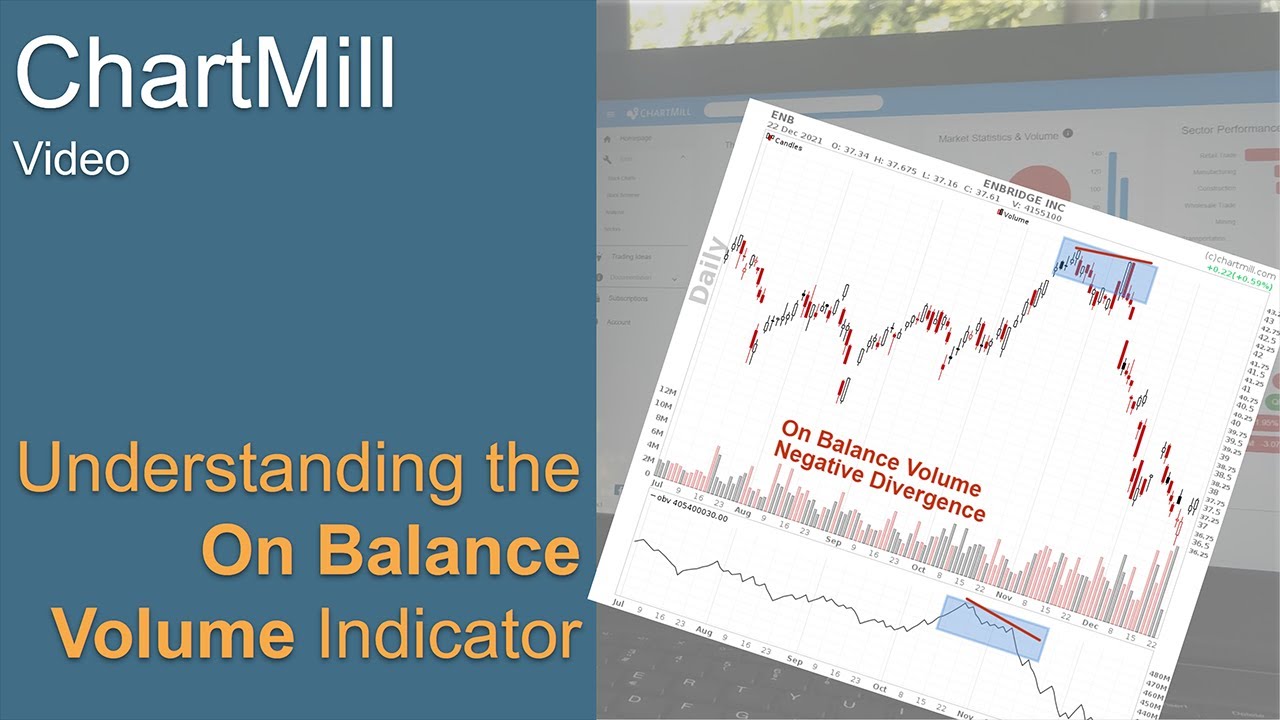
Understanding the On Balance Volume Indicator (OBV)

The golden cross and death cross explained
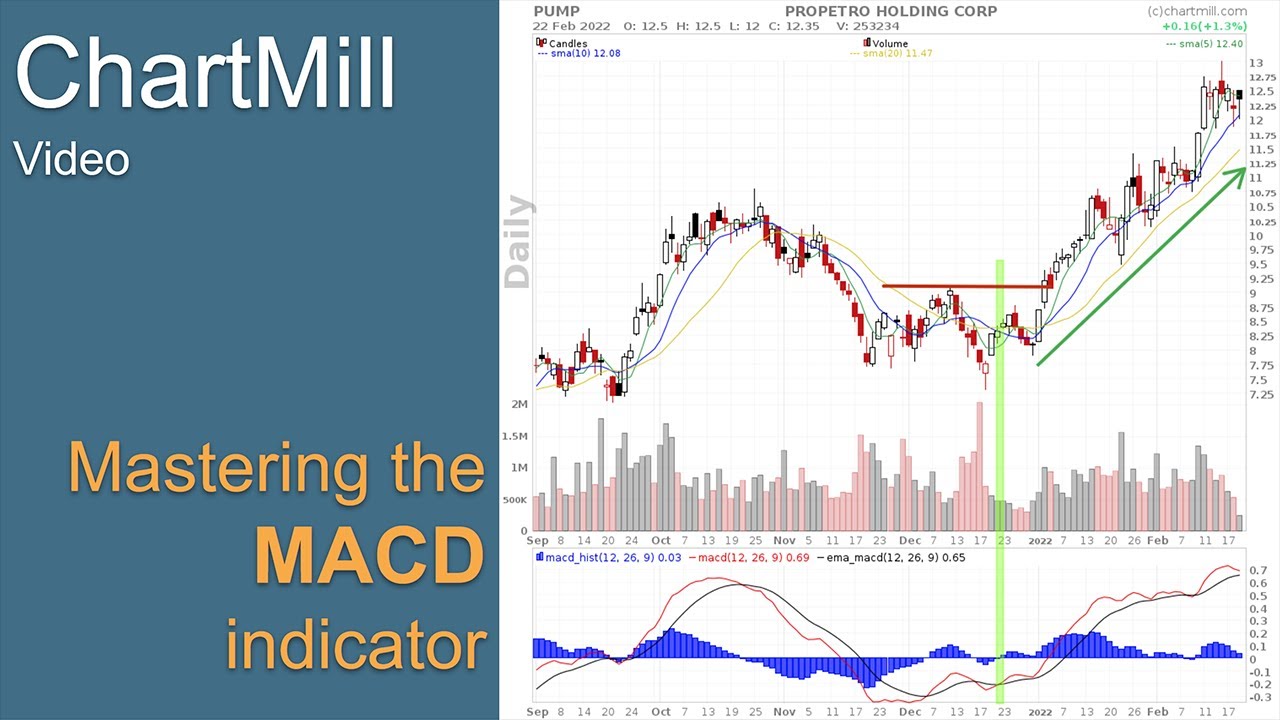
Mastering the MACD indicator in your Trading Strategy
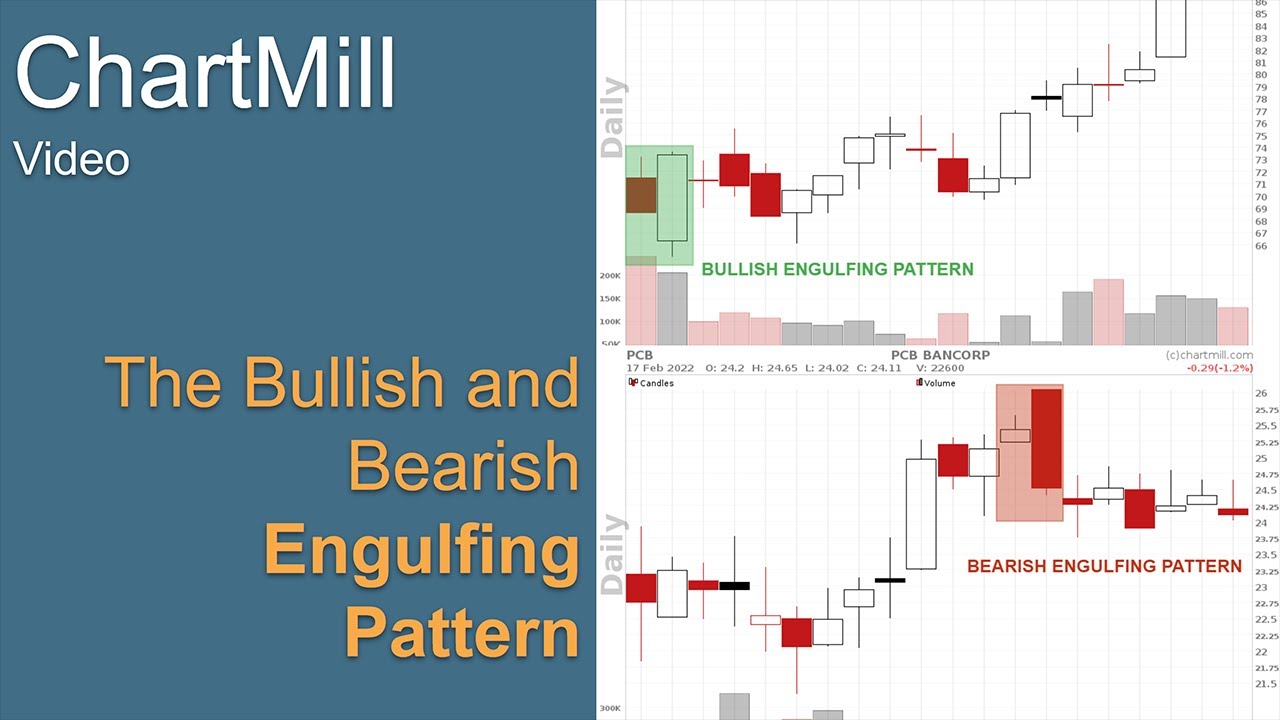
How to Trade Bullish and Bearish Engulfing Patterns?

How to trade the bullish flag pattern
Trading strategy for the wedge chart pattern
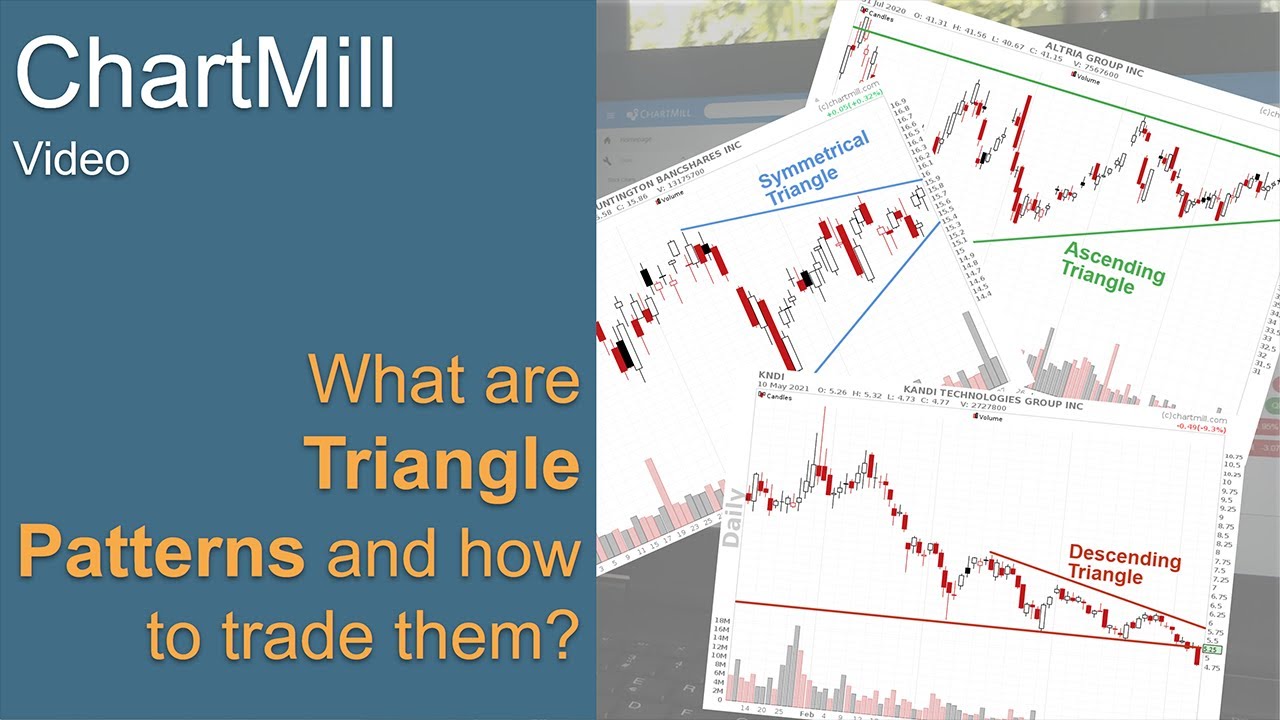
What is the triangle chart pattern and how to trade it
This technical indicator was created by technical analyst Bill Williams, one of the most famous American financial analysts of the second half of the 20th century. The awesome oscillator is a momentum indicator that provides insight into how strong or how weak a stock is performing. This is done by comparing the recent market momentum with the more general momentum over a longer period in the past. This confirms existing trends or can be used to anticipate changes in trends.