Wedge chart patterns
The Wedge Chart Formation
A wedge is a chart formation very similar to the symmetric triangle pattern. The main difference between them is in the slope of the trend lines from which the pattern arises.
In the technical wedge formation, the two trend lines run in the same direction, but with different slopes. These trend lines run toward each other, thus creating an increasingly narrow channel. This creates the typical wedge shape.
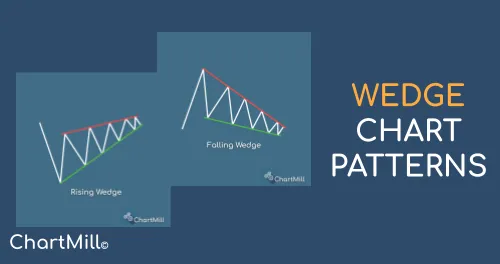
A rising and falling wedge chart pattern
Wedges are considered technical reversal patterns.
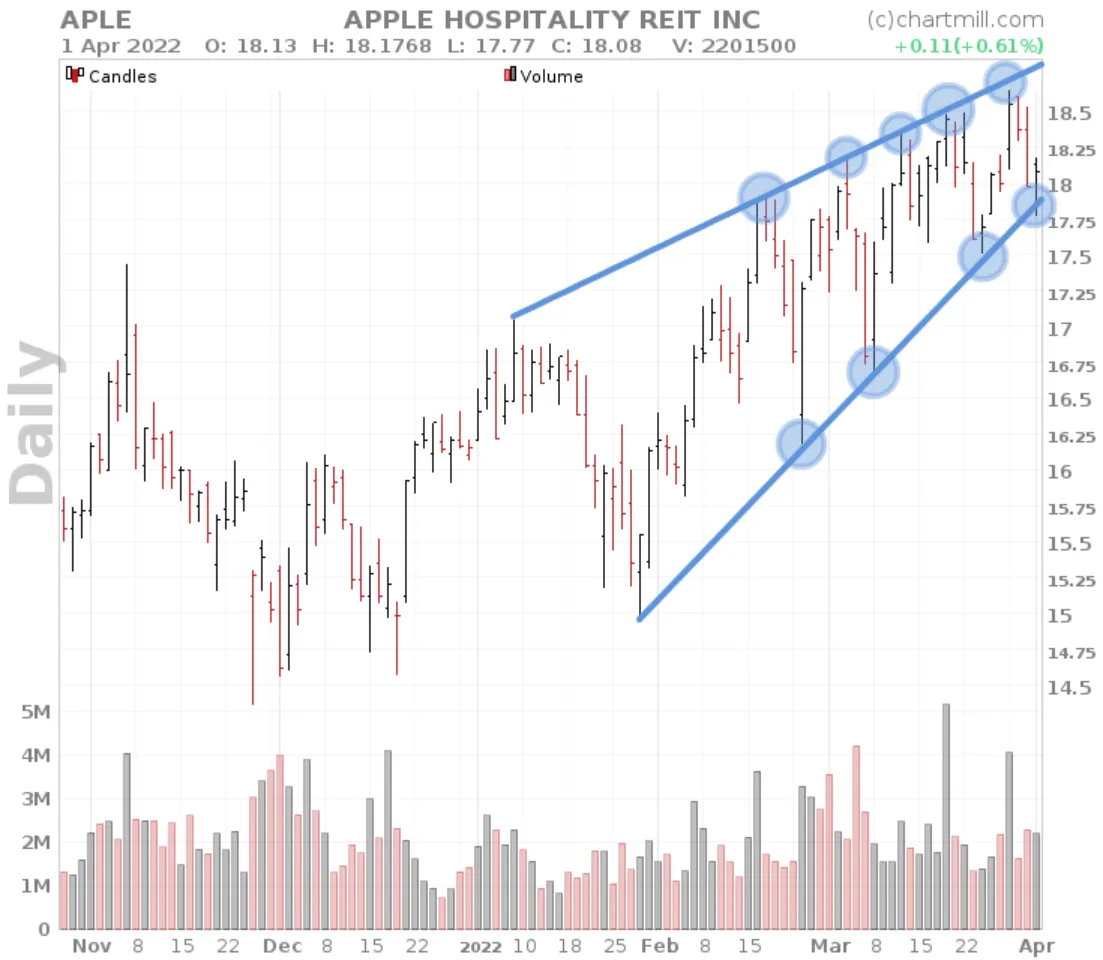
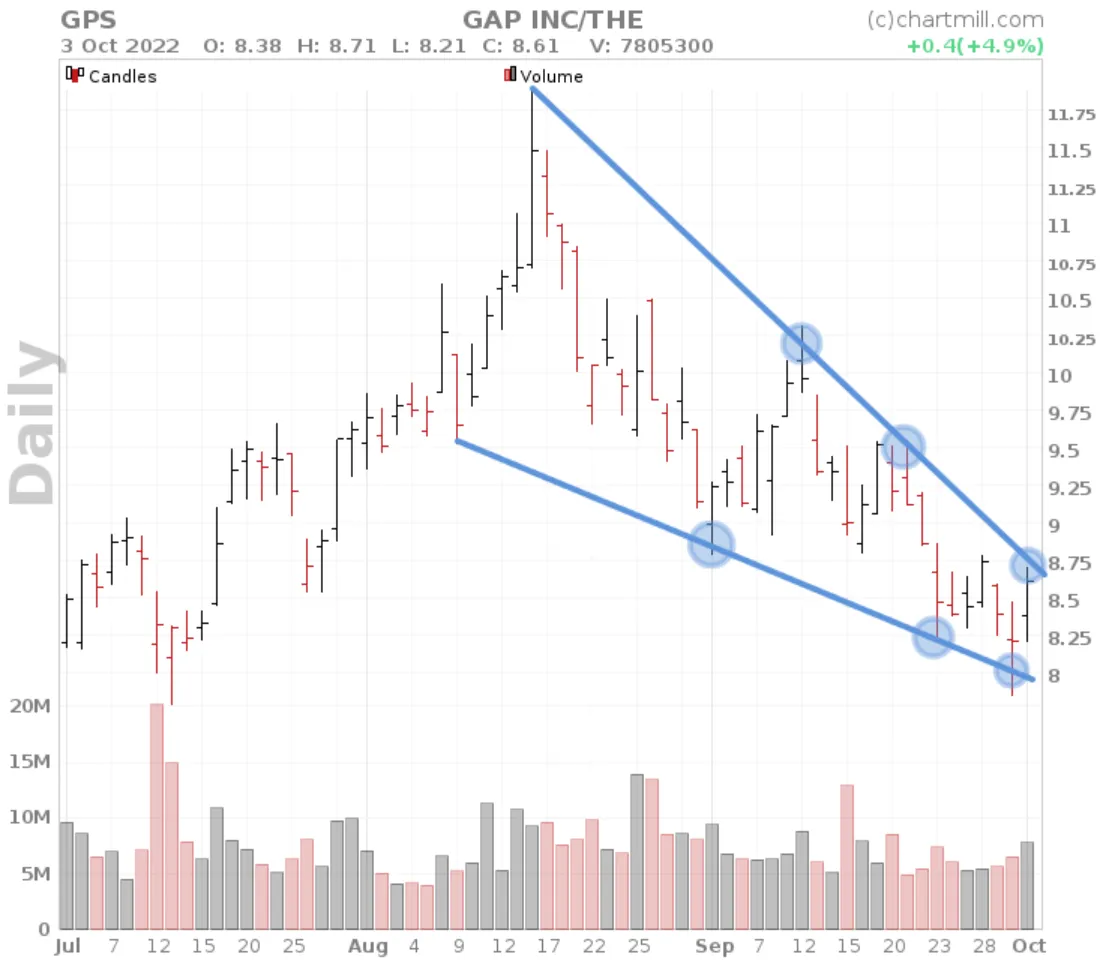
The rising wedge formation is bearish, the falling wedge formation is bullish.
With the rising wedge, there is a short signal as soon as the price breaks through the lower ascending trend line. This is the trend line with the sharpest slope.
The falling wedge gives a buy signal if the price crosses the upper descending trend line. Again, this is the trend line with the sharpest slope.
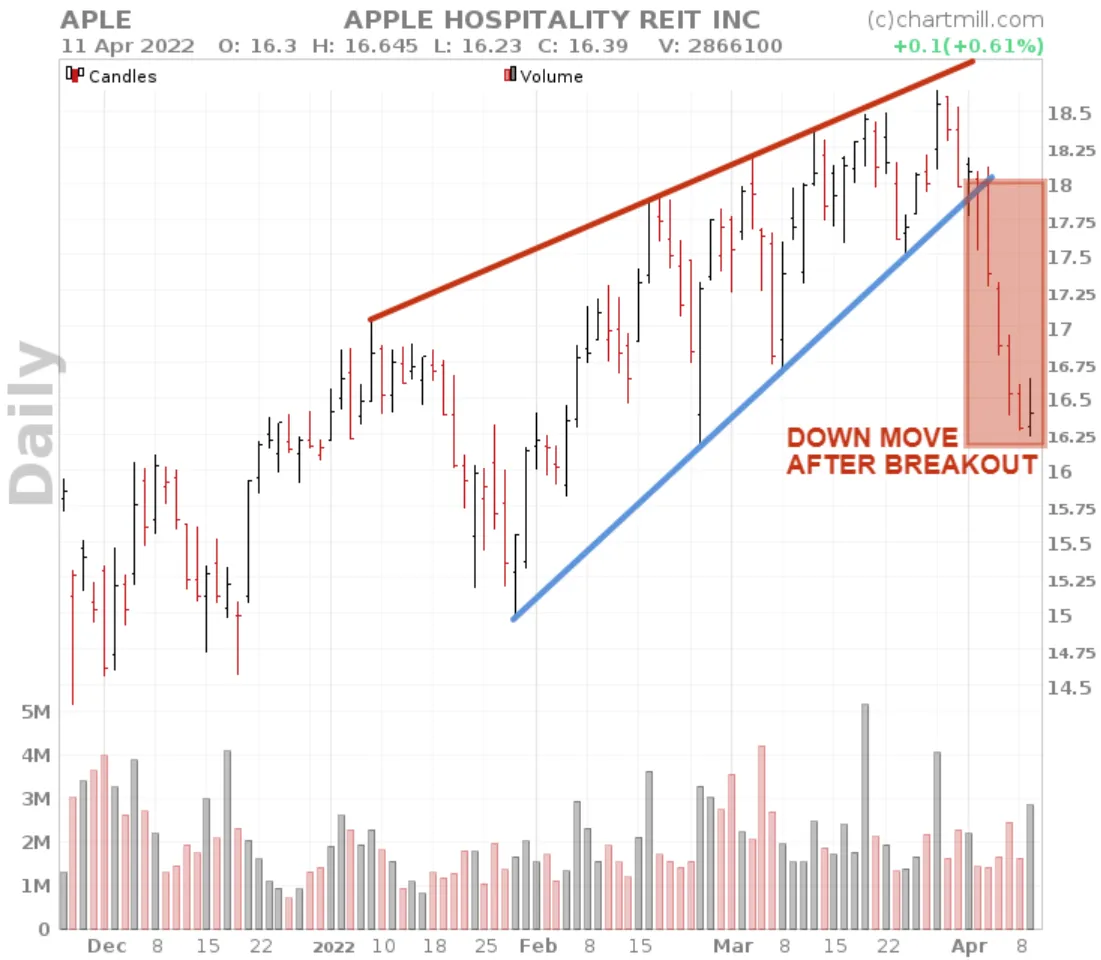
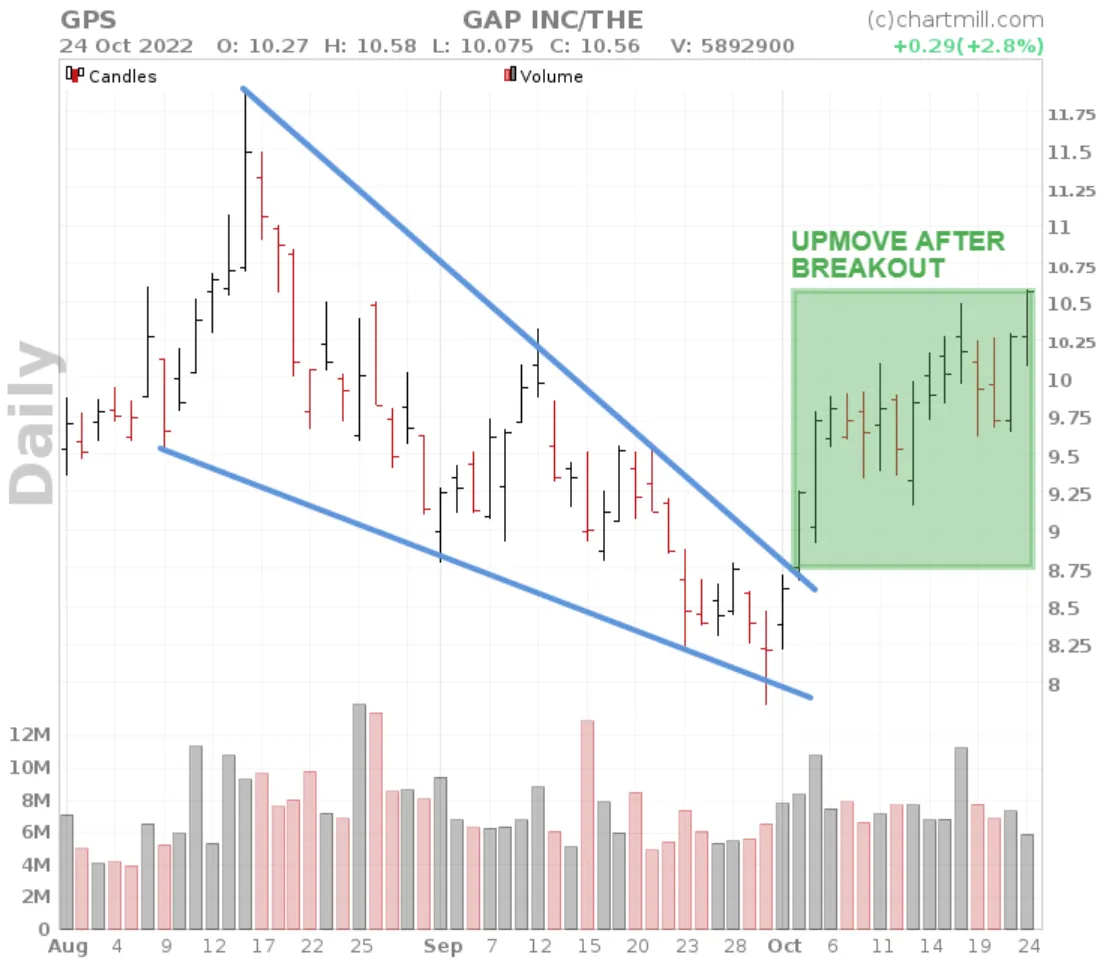
A bearish and bullish breakout
Related Articles
More detailed information about the various individual wedge formations can be found here: