The Red Dog Reversal a Mean Reversion Strategy for Day and Swing Trading
INTRO
Extreme price movements, both upward and downward, are associated with high volatility and are usually short-lived. This mean reversion strategy tries to capitalize on this by taking advantage of the moment when the movement loses momentum and returns to its average. The Red Dog Reversal strategy looks for stocks which are currently in such a price extreme. Once we have identified such stocks an exact entry point is set with a clear stoploss. The strategy is initially intended as a pure day trading play, as we should not lose sight of the fact that we are acting against the current trend. Depending on how the trade evolves during the trading session you can however decide to leave (part of) the position open and speculate on a multi-day countermove.
Warning!
A word of warning in advance for those who wish to hold positions overnight. The stops used in this day trading strategy are short to sometimes very short. This means that if the movement continues over several days, the profits could mount up nicely. But that also applies to the possible loss! An open long position where the initial stoploss was only 20 cents and where the price suddenly opens $1 lower the next day can have serious consequences for your portfolio!
HOW TO OBJECTIVELY DETERMINE IF A STOCK IS SHOWING A PRICE EXTREME?
Price versus SMA
An easy visual way is to view the stock in relation to a moving average, for example the SMA20.
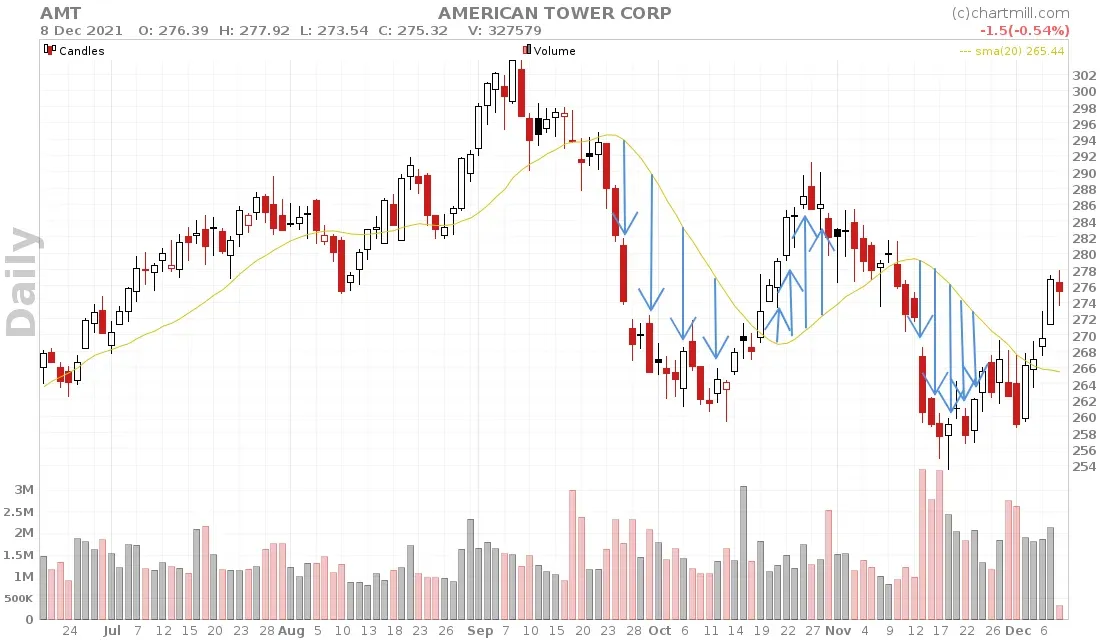
Sudden violent rises or declines cause a noticeable gap to appear between the price and the SMA20.
Oscillators (Stochastics, RSI)
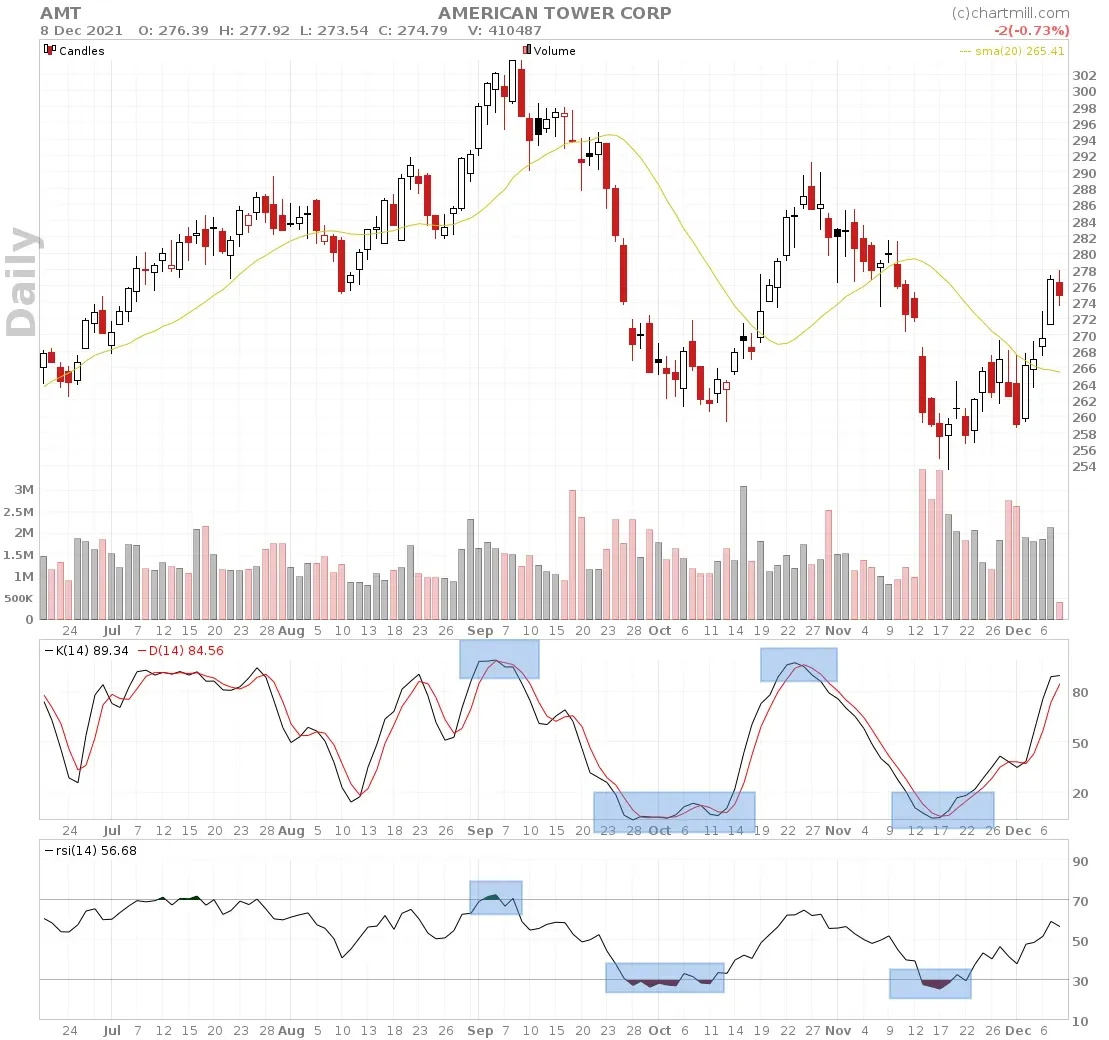
Oscillators such as the Stochastics and the RSI also indicate well where price extremes occur on the chart and when oversold and overbought levels occur. These indicators converge well with the earlier visual method using the SMA20.
THE RED DOG REVERSAL STRATEGY
Now that we know how to objectively define a price extreme, it's time for the actual strategy.
The reversal signal
Since we are talking about a mean reversion strategy we are going to look for a reversal signal where we take a position which is opposite to the existing trend.
Conditions for a buysetup:
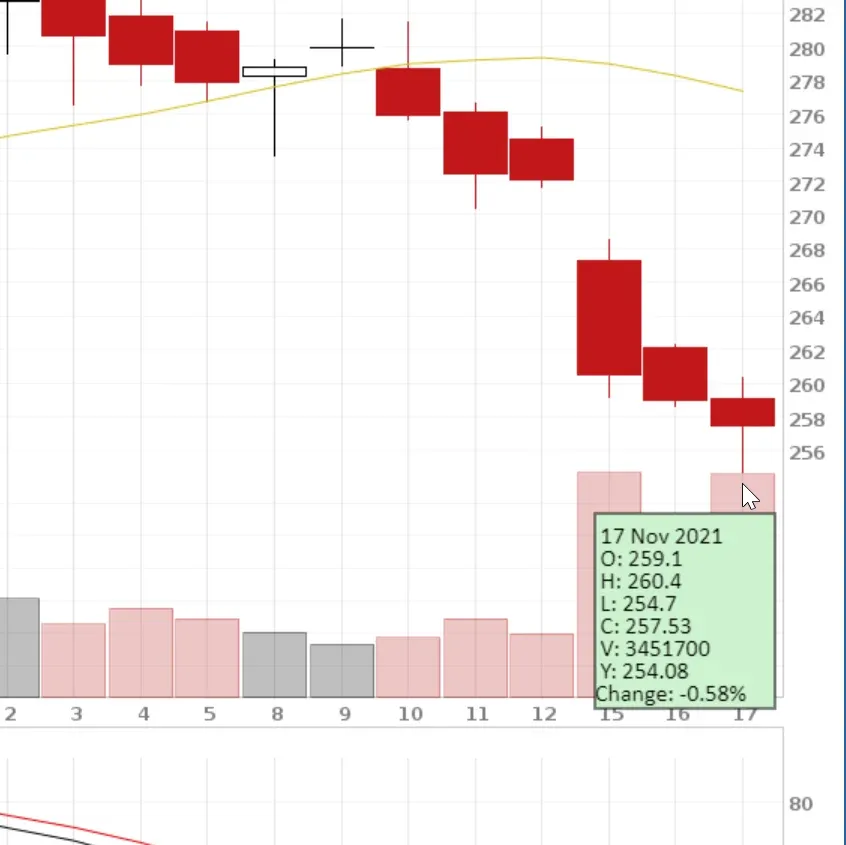
- The stock must show a price extreme, the price is relatively far from the SMA20 and the Stochastics indicator < 20 or the RSI < 30. The chart below shows the AMT stock on date of November 17, 2021. The stock fell quite heavily and there was a lot of sell volume. As a result, the price fell quite far below the SMA20. At the same time, the Slow Stochastics indicator also reached a low and the price is currently at a support level.
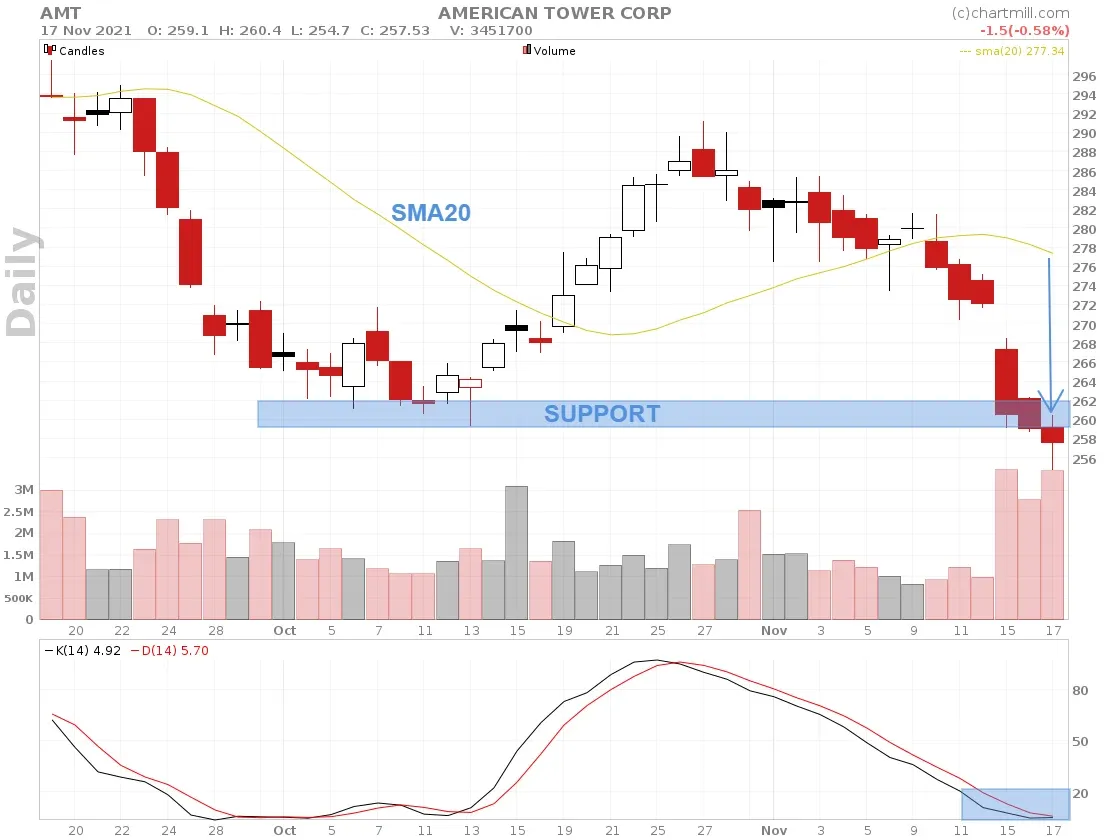
- Once the above conditions have been identified, it is necessary to wait and see how the stock opens the next trading day. The opening determines whether the strategy can be activated or not. The price should open above the low of the last candle. In the case of AMT, this means an opening price above $254.7 (the 2021/11/17 low).
- We then examine the 2-minute chart of the next trading day, 2021/11/18:
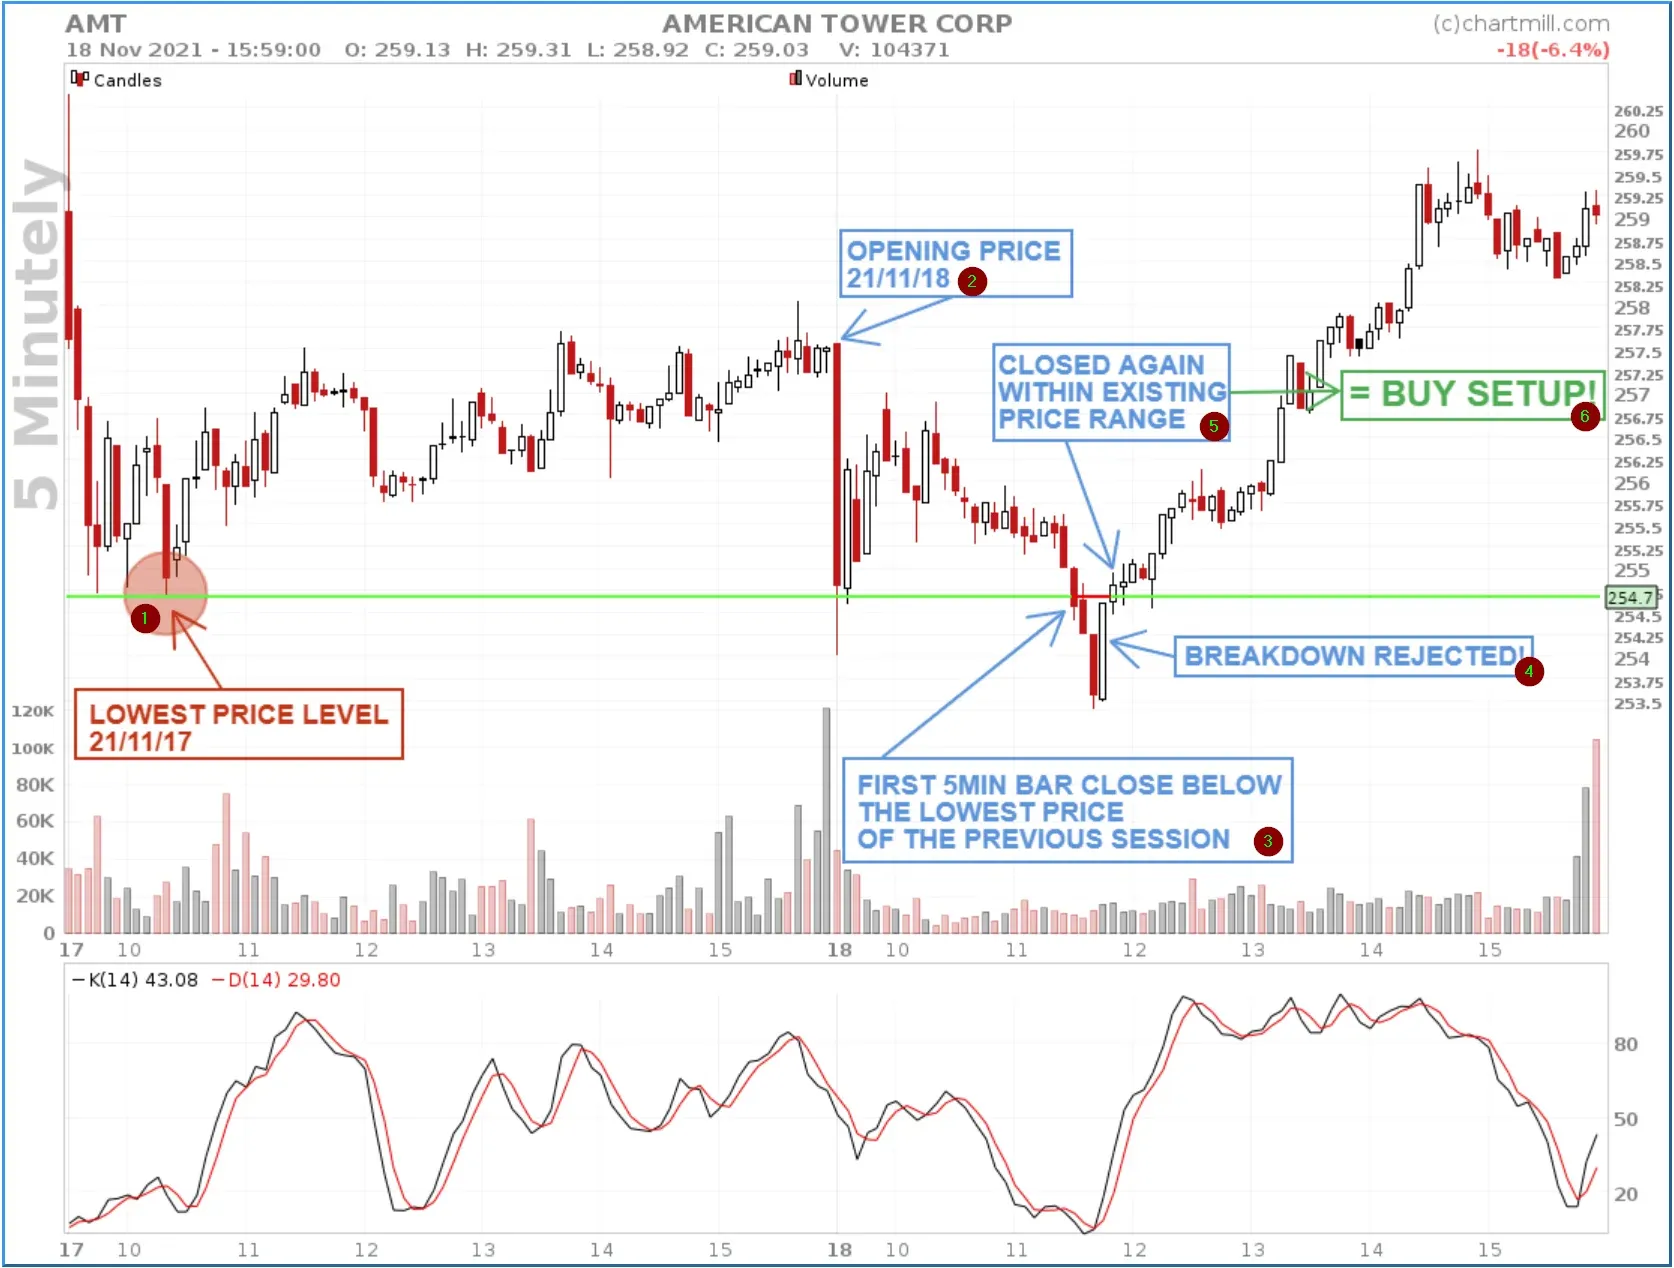
- The lowest price on date of 21/11/17
- The price opens above the low of the previous session
- At 11:35 a.m., the first red candle is visible which closes below the previous day's low. The next two candles also show lower prices. This is an indication that the existing downward trend will be continued.
- However, the price recovers with a first long white candle (after five consecutive red candles). The buying volume is noticeably higher than the selling volume and the breakdown move is rejected.
- The next candle closes again above the previous day's low.
- This sequence of events provides the actual buy setup.
The actual setup
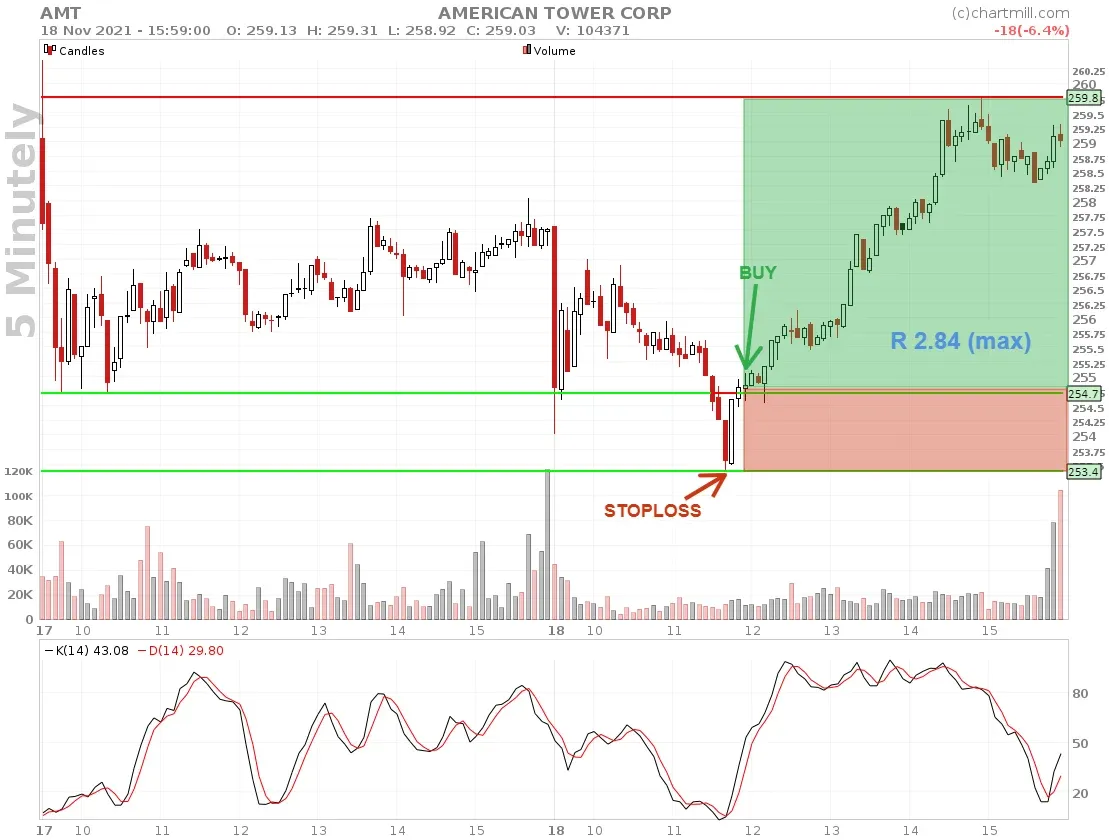
- The stock is bought at the opening of the next candle which follows the first candle that again closes above the previous day's low.
- Stoploss is placed below the low of the current day.
In this example the long position has never been in any danger. The price closed at the end of the trading day with a profit which was more than 2.5 times the initial risk.
Below the chart as of the date this article was written (2021/12/10):
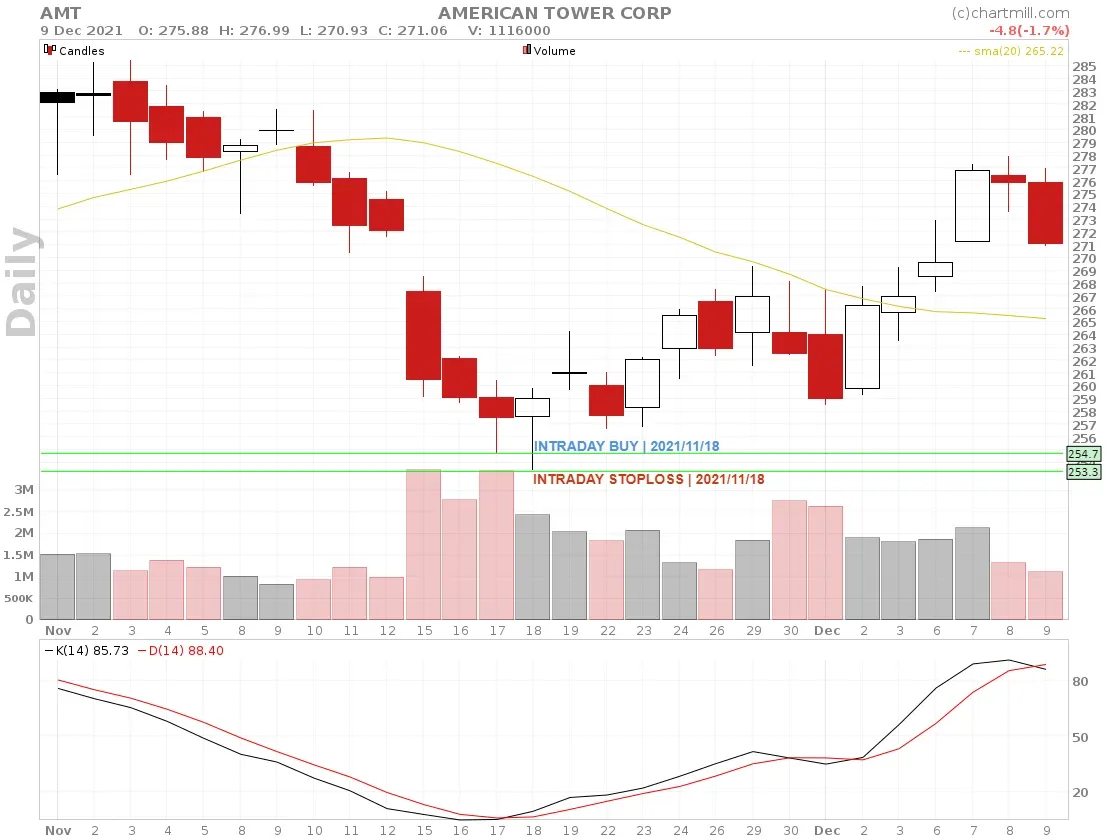
Those who held some of the long position were able to profit from the continued rise. The SMA20, for example, was a nice target point for this setup.
Example of a short setup
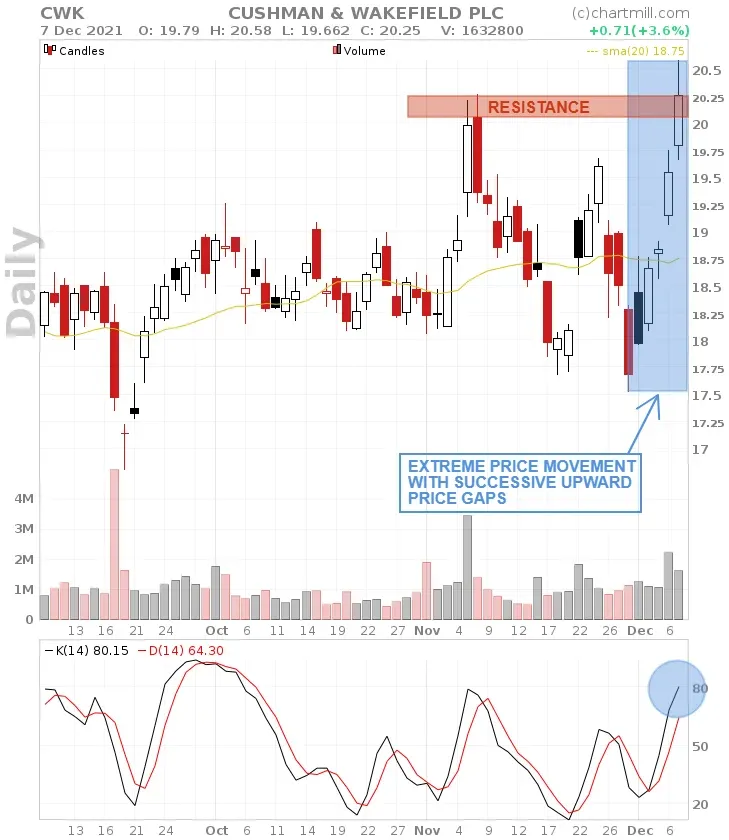
- The chart of CWK shows a clear price extreme. The price has risen above $20.5 in just 5 days since the bottom at $17.5. That is a move of more than 17%. The price is well above the SMA20.
- The last trading session brought the price up against an existing resistance zone.
- Furthermore, a strong rise above the 80 level is seen in the Stochastic indicator, (overbought zone).
The next trading day we will be looking first and foremost for an opening price that opens below the high of this last candle. Below, the 5m chart of CWK.
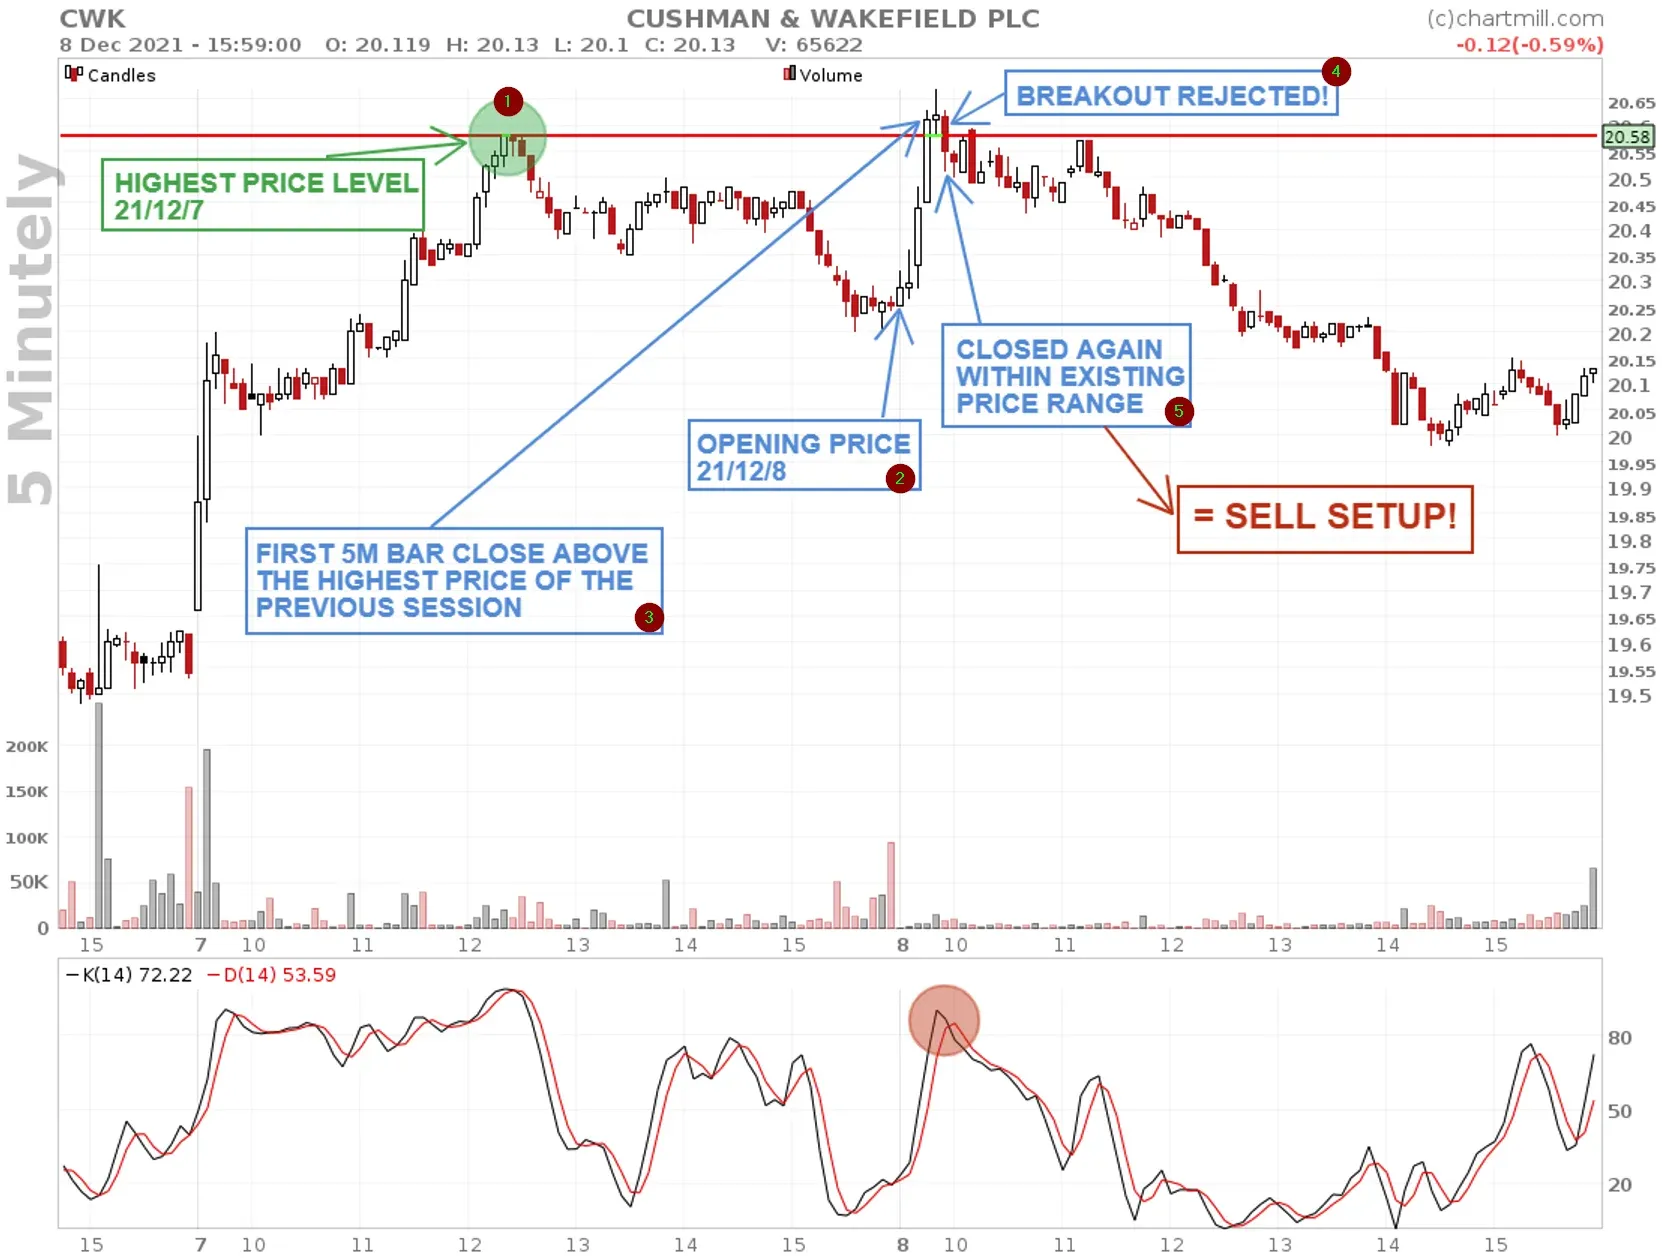
- The top on date of 21/12/7
- The price opens below the high of the previous session
- The price immediately continues its strong rise and at 09:50 we notice the first long white candle closing above the previous day's high. This is an indication that the upward trend seems to continue.
- The price however drops back below yesterday's low, as a result of which we might be dealing with a false breakout move.
- The red candle, which effectively closes below the previous day's low, confirms this and gives us a potential sell setup.
The actual setup
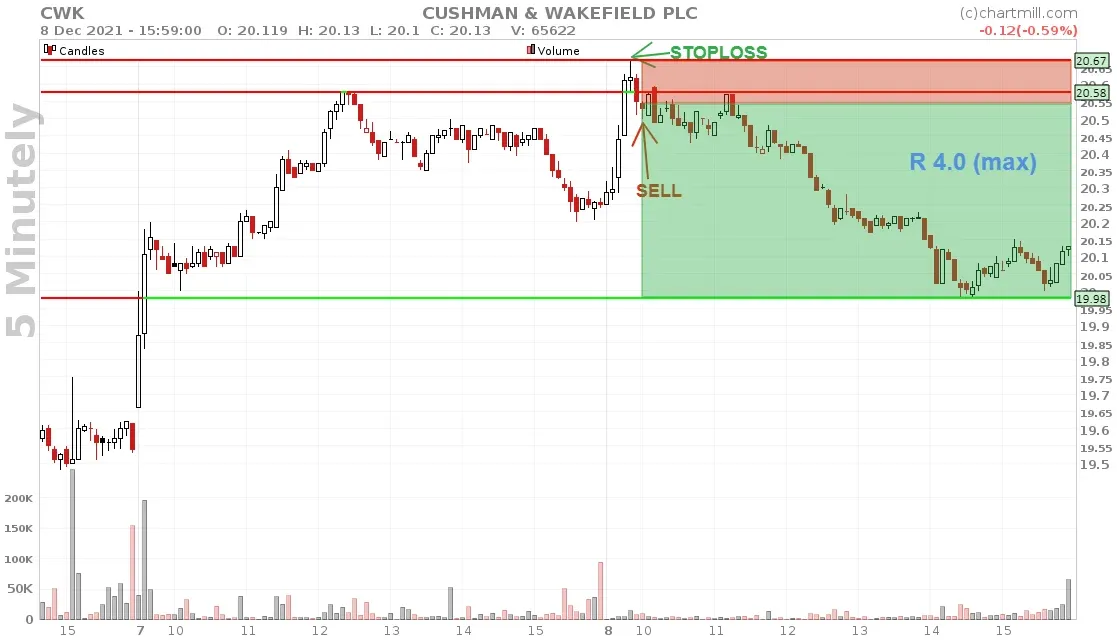
- A short position is taken at the opening of the candle that follows the candle which again closes below the previous day's high.
- Stoploss is placed above the highest price of the current day.
Here too this turned out to be a perfect entry. The potential profit was up to four times the risk for those who closed the position before the end of the trading day.
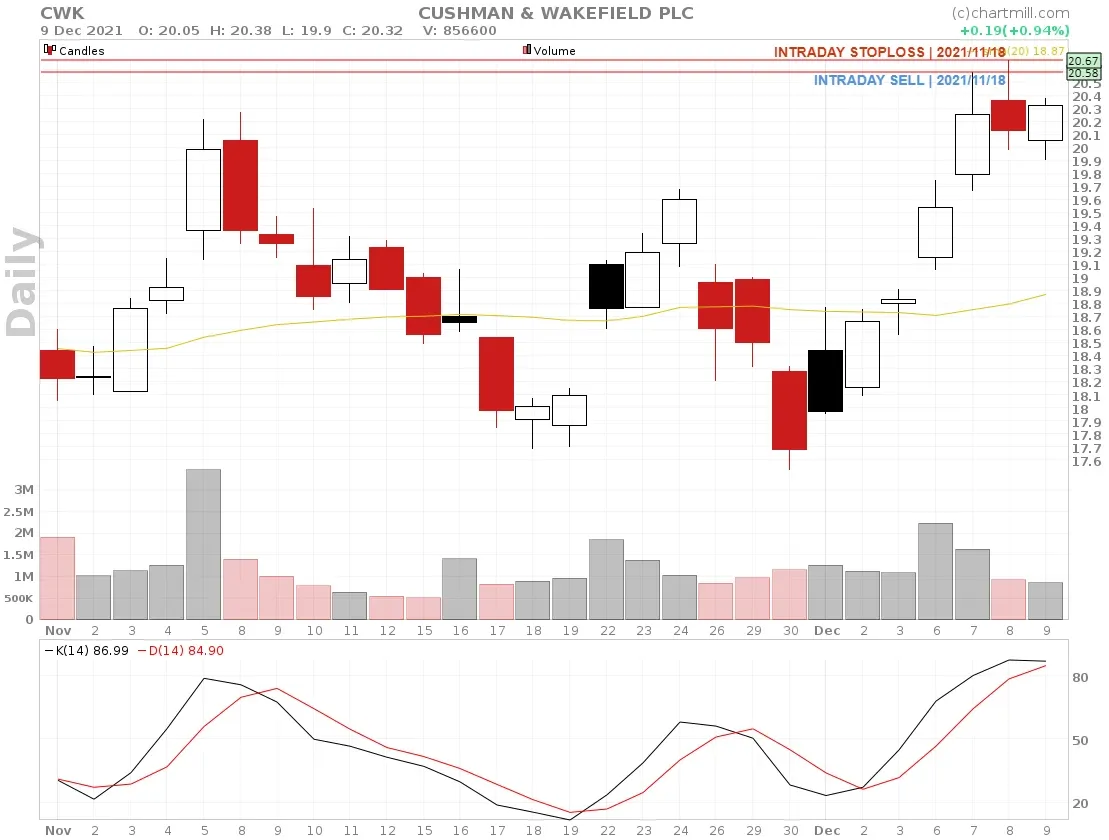
Below is the chart at the date of writing this article (2021/12/10):
HOW TO SCREEN SUCH SETUPS USING CHARTMILL?
Screen 1 (EOD) - identifying the price extreme
This screen > to be used before the market opens, shows all US stocks listed more than 9% lower than the SMA20 and with a Slow Stochastic indicator lower than 20. These stocks can be used to screen for a potential intraday reversal upwards.
Link > Canada only
Link > Europe only
This screen shows stocks listed more than 9% higher than the SMA20 and with a Slow Stochastics Indicator higher than 80. These stocks can be used to screen for a potential intraday reversal downwards.
Link > Canada only
Link > Europe only
These screen filters are very suitable as a basic selection which can then be filtered manually. Keep the best candidates in a watchlist and transfer the setups to your actual trading platform before the market opens.
The Red Dog Reversal Candlestick pattern.
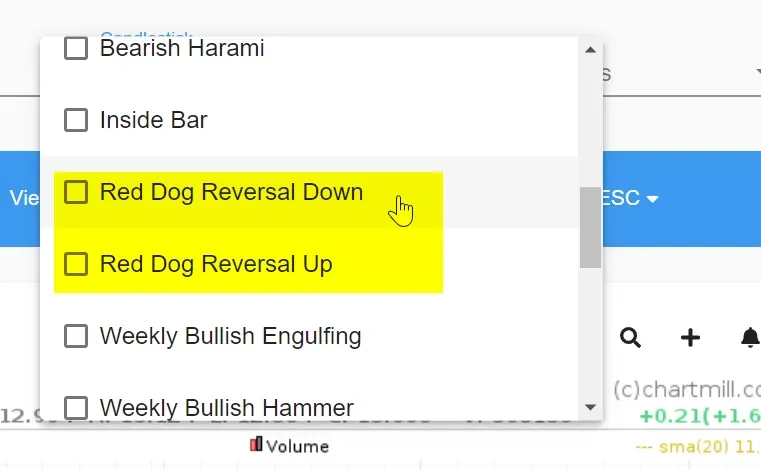
With our stockscreener you can use the complete Red Dog Reversal pattern as a filter, with a distinction between the Red Dog Reversal Up and Red Dog Reversal Down pattern. This filter adjusts intraday but keep in mind that prices are delayed at least 15 minutes.
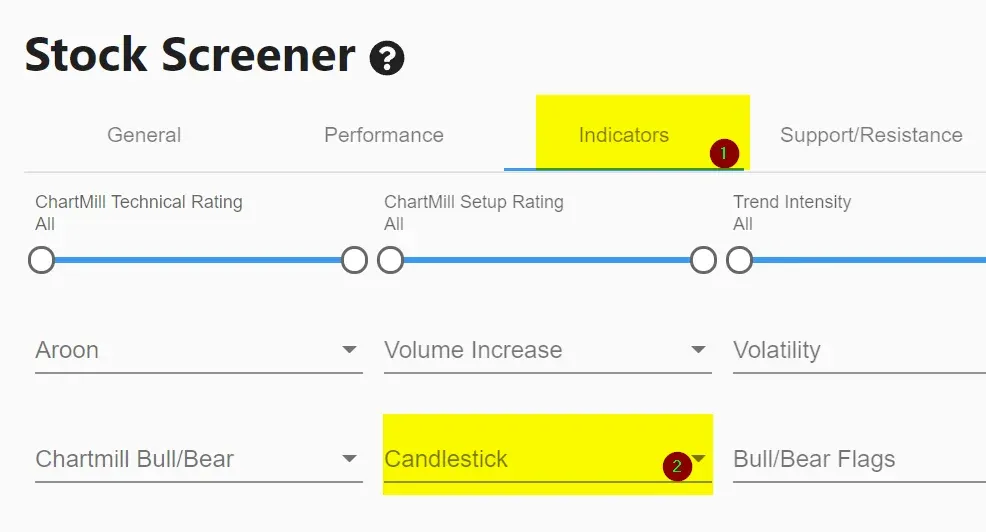
Select the ‘Indicator’ menu in the Stock Screener:
For example, this screen shows all US stocks where the Red Dog Reversal Up pattern has completed after the price has dropped at least 5% in one week.
Link > Canada only
Link > Europe only
This screen shows all US stocks where the Red Dog Reversal Down pattern has been completed after the price has risen at least 5% in one week.
Link > Canada only
Link > Europe only
TO CONCLUDE
As with other strategies mainly based on price action, it comes down to finding as many converging elements as possible to support your setup. A price extreme where the price is at the same level as a support or resistance level or where a double bottom or top is formed, for example, are additional elements which can increase the chance of success.
For those who want to hold positions overnight by means of this strategy we repeat the warning that the intraday risk in that case should absolutely be reduced if you do not want to be confronted with unpleasant surprises when the price suddenly opens much lower (in case of a long position) or much higher (in case of a short position) than your set stoploss.