Popular Screens: Strong Stocks near New High
By Aldwin Keppens - reviewed by Kristoff De Turck
Last update: Apr 19, 2024
In this article we will discuss the Strong Stock Near New High screen. Also check out the General Trading Tips, which gives some general pointers.
The Strong Stocks near New High screen is a popular screen at the time of writing. It is also one of my personal favorites which I visit at least once a week. The 2 main filters of this screen are included in the title:
- Strong Stocks: A proprietary chartmill algorithm to identify the best stocks in the market. These are the market leaders and typically also the kind of stocks that are traded by High Growth Stock traders and investors. Some more details on strong stocks can be found here.
- Near New High: The selected stocks will be near a new 52 week high, which is typically a strong signal. 'Near' means that the current price can be up to 7% from the 52 week high.
Unlike other screens like Bull Flags or Momentum Squeeze Play Setups, this screen does not have good setup quality build into the rules and requires more manual/visual filtering. However, going over each of the charts in the results keeps you in touch with the market and tells you which stocks are making progress. Very often you will spot nice setups that we somehow missed in other screens.
Next to finding setups for working with today, we may also find nice stocks that are perhaps a little bit extended at the moment, but we should keep an eye on them for the future. We can store those stocks in a watchlist an come back to them at any time. A nice variant for identifying market leaders you get by replacing the 'near new high' with a 'new 52 week high today'.
Evaluation of the screen results.
Visiting the screen today gives 116 results. By default, the results are sorted by relative strength, so this implies we see the strongest stocks first. It is important to understand that an evaluation is always personal and depends on what you are looking for. Typically I will be looking for stocks that are inside a base formation, that can potentially break out. The goal would be to enter the stock on the breakout and to hold it a couple of days to a couple of weeks. A 5 to 15% move is really a great success! At the same time I also want to make sure that I see a good exit point when the breakout fails. Other traders may look for momentum and volatility that has already started and jump on for a day trade or a shorter term trade. So .... whatever works for you is fine of course.
Another thing that is important to understand is that there are never any guarantees and in the end being able to limit your losses and making enough from your profits to compensate those losses is what makes you money. It really does not matter what the candidates that come out of this article do in the next week or so. Even if they all fail, doing this over and over again is what will generate results in the long term.
Lets start our evaluation!
Stocks to dismiss
Some stocks will be nice examples of stocks that are extended at the moment. But still, they all had very nice breakouts recently (probably on earnings) and they do make perfect candidates for keeping an eye on. The price needs to settle for these stocks and when this happens, nice entry points may come.
Stocks to be monintored
Going over the charts one by one on the first 4 pages (80 charts) resulted in the selection below.
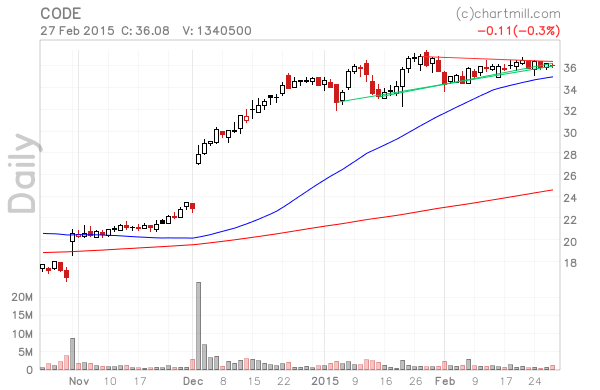
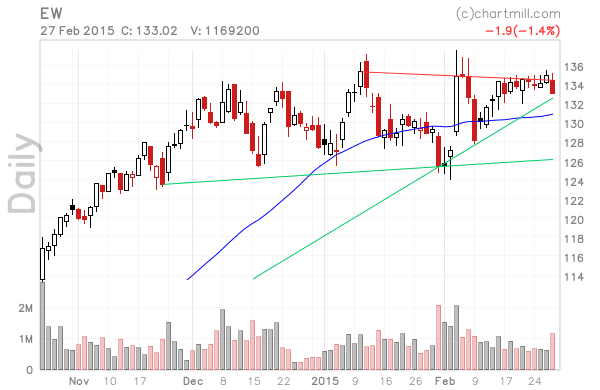
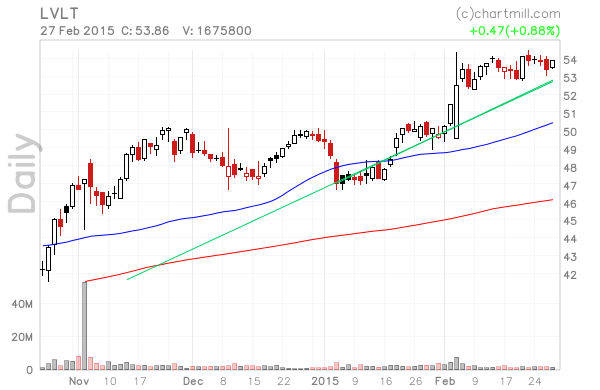
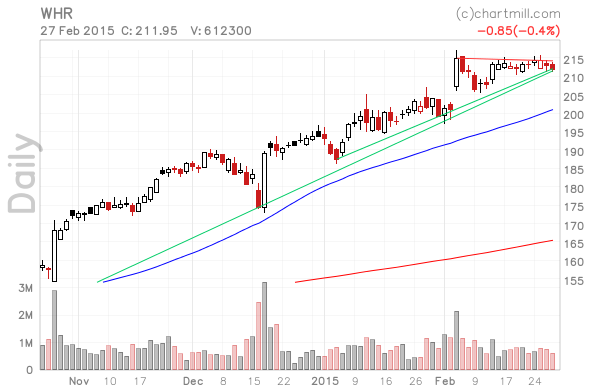
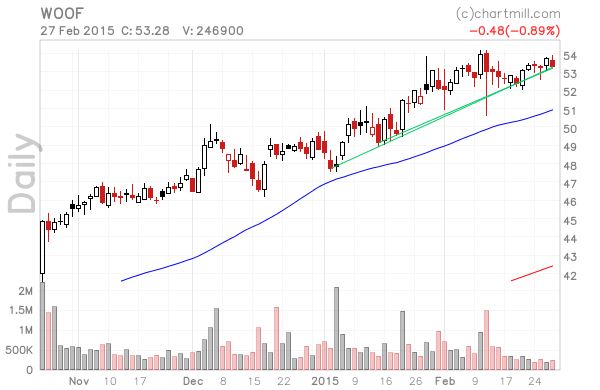
The common pattern here is that we observe horizontal bases in all selected stocks. A typical way to handle these is to place buy stops above the high and a stop either conservatively below the horizontal base or more aggressively below the low of the last day. Especially CODE shows a very tight pattern.


