Mean Reversion Screens - RSI Indicator

Mean Reversion Screens - RSI Indicator Image
RUN IN STOCK SCREENER
(19)

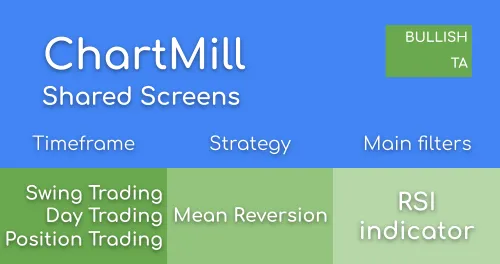
This screen shows stocks that have experienced a sharp decrease in price in a short time and are therefore at least 9% away from their 10-day moving averages and where the RSI2-indicator is extremely oversold (<10). This makes these stocks ideal candidates to look for mean reversion LONG setups on the assumption that the price will at least temporarily move back towards the average price. Remember that these candidates are merely watchlist setups. Confirmation is still needed, so be sure to read the article below that explains exactly what the strategy entails and how to apply it. Trade safe!

Day TradingSwing TradingPosition TradingMean Reversion
Momentum
Shared by user chartmill - 4 years ago

Related Articles

Related Videos

Stock Screener Settings

sma10: SMA(10) Below SMA(20)

This ensures that the short term trend is down

Today<=0%

This ensures that the most recent day closed negative

Exchange: US Only

Personal Preference

Price: Above 5

Minimum Price filter

(close<=(sma10*0.91))

Custom filter, current price is at least 9% below SMA10 price

RSI: RSI(2) Below 10

RSI-indicator extremely oversold

Average Volume: 50 SMA > 300K

Minimal Liquidity

Signal: New 10 day Low Today

Current lowest Price in 10 days

RUN
Chart Settings

Daily charts

Regional Run

Run this screen in your favorite region. You can always further fine tune the screen by changing the general settings after it opened in the screener.