Trade the Swing with the Force Index Indicator
Swing Trading with the Force Index Indicator
In this article we examine the screening possibilities regarding the Force Index Indicator in ChartMill and a specific Swing Trading Strategy whereby this indicator is used both as a trend indicator but also as a buy or sell warning. More information on where this indicator comes from and what it actually measures can be found in this article.
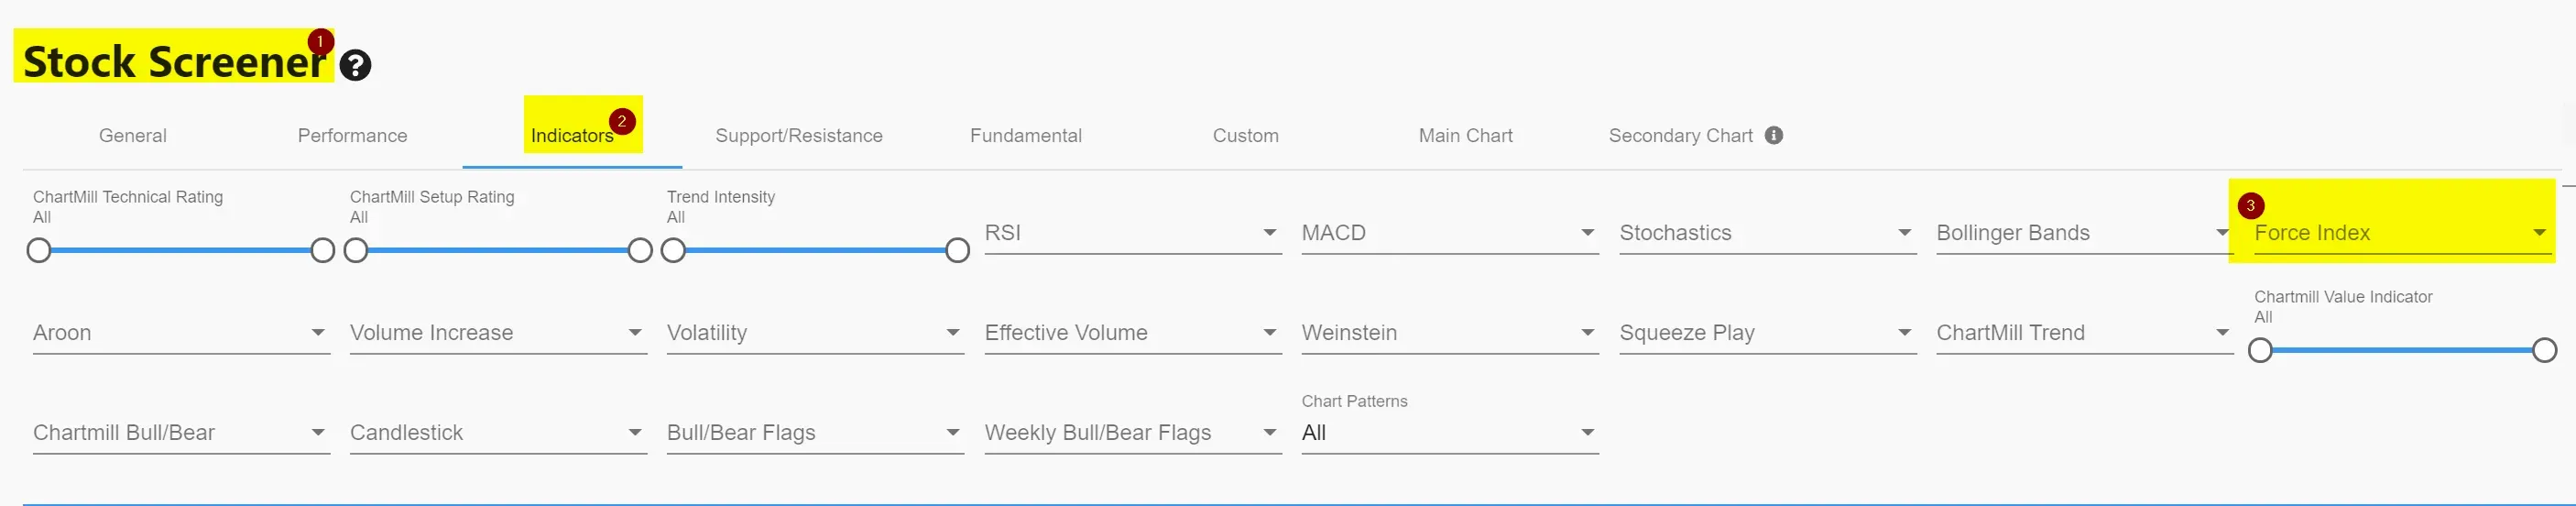
Screen filter Capabilities in ChartMill
In the screener there is a Force Index filter available which is set to the default time interval (14 periods). Select the Stock Screener menu, go to the indicators tab and click on the appropriate force index filter. There are three possible filter options.
Filter Options
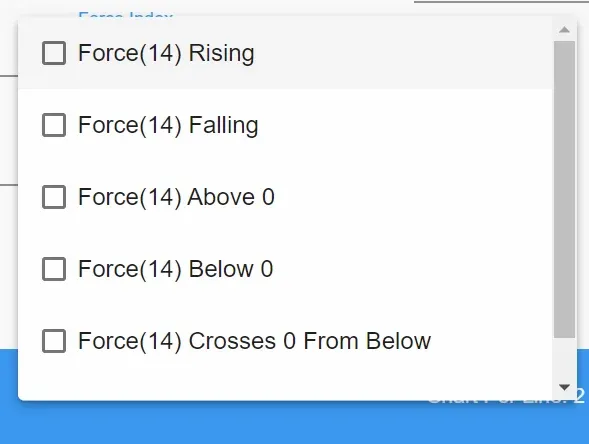
Filter Option 1
- a declining Force Index
- an increasing Force Index
This does not take into account whether the indicator is above or below the value 'zero', only the rising or falling characteristic is important.
Filter Option 2
- Force Index below 'zero'
- Force Index above 'zero'
This does not take into account whether the indicator is rising or falling, only the position of the indicator plays a role.
TIP: You can combine filter options 1 and 2. For example, you can set that the indicator should be rising but still quote below the zero line.
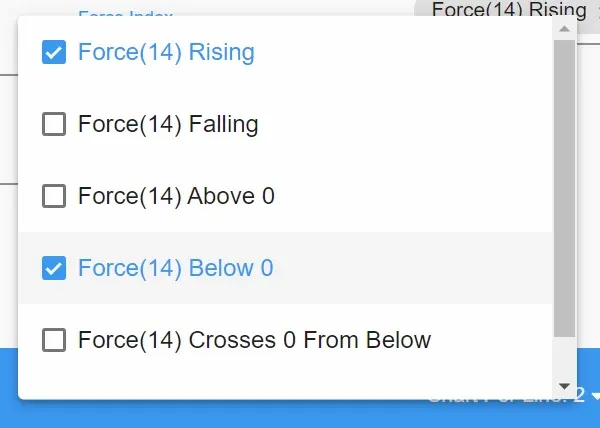
Filter Option 3
- Force Index crosses zero line upward
- Force Index crosses zero line down
A few examples of filter screens
- This screen shows all stocks trading above their SMA200 and with the Force Index breaking the zero line upwards.
- This screen shows all stocks trading below their SMA100 and with the Force Index falling but still above the zero line.
Using the Force Index in a trading strategy (as a trend and signal indicator)
This strategy looks for stocks whose price is in a bullish trend but where the price has fallen below its five-day moving average in recent days. We try to use this pause to take a long position in the existing direction. We use a relatively short stoploss which protects us if the decline continues and there is a real trend reversal. Because we want to take advantage of a short price dip in an existing bullish trend we refer to it as a 'retracement strategy'.
First of all, i use this screen filter to select the stocks to which we are going to apply the strategy.
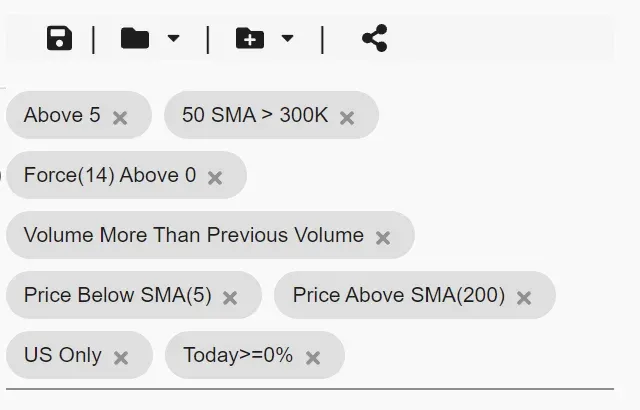
Direct link to the shared screen page.
With these filter settings, only stocks whose price is above the SMA200 but below the SMA5 are selected. The price may not have closed negative in the last session and the volume must be higher than the day before. In addition, the Force Index (14) must be above the zero line.
Next, add the Force Index indicator three times on the chart. The Force Index 100, 14 and 2.
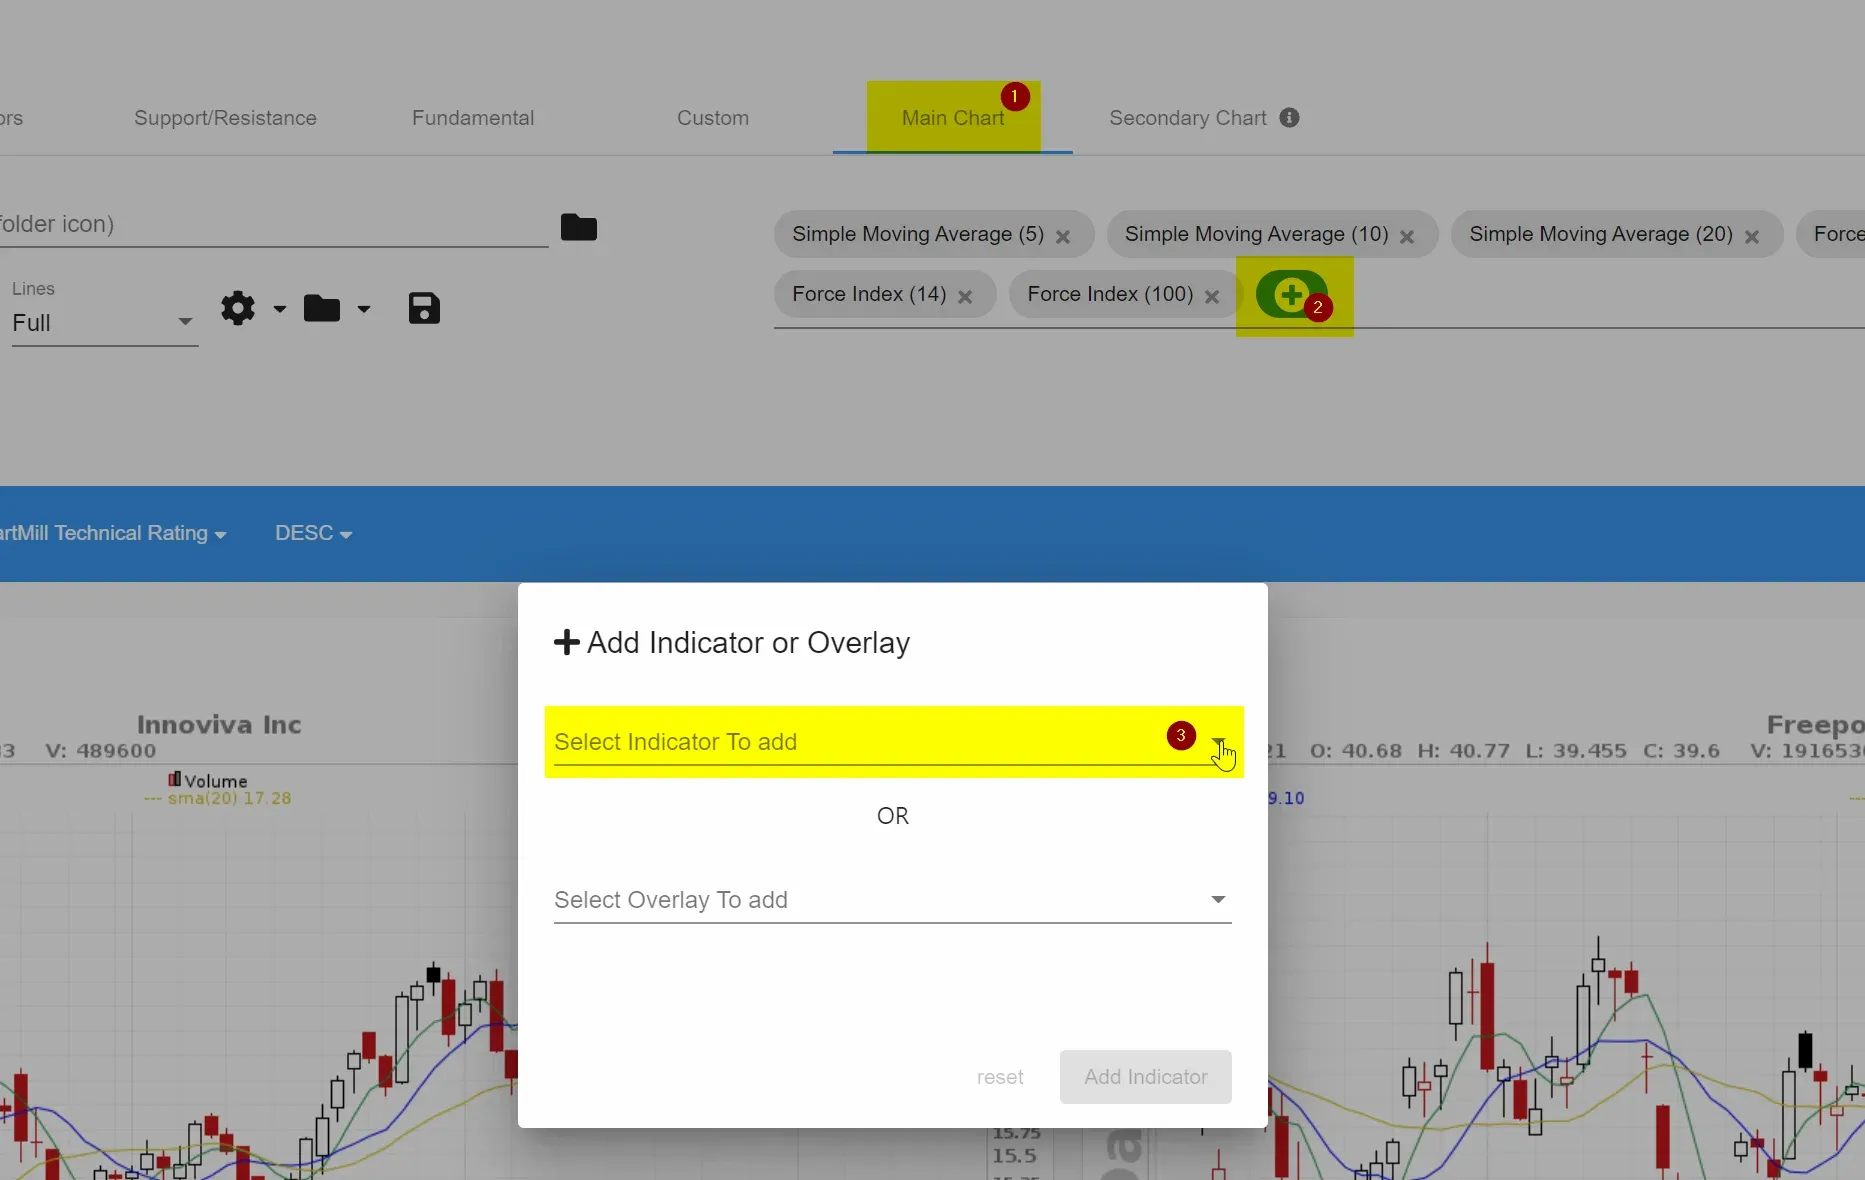
In the example below, I have also added some simple moving averages. The chart should now look like this:
Next, you first examine the two lower indicators, being the Force Index (100) and (14). These should both be above the zero line and thus turn green. As soon as the Force Index 100 or 14 is red, the stock is not eligible for a trade setup. The fact that both these intervals of the indicator are green assures us that the medium and short term are still positive.
As for the Force Index (2), we focus on the stocks where the indicator is still in the red but is about to intersect the zero line upwards or has just crossed it upwards. A few examples will make it obvious what is meant by this.
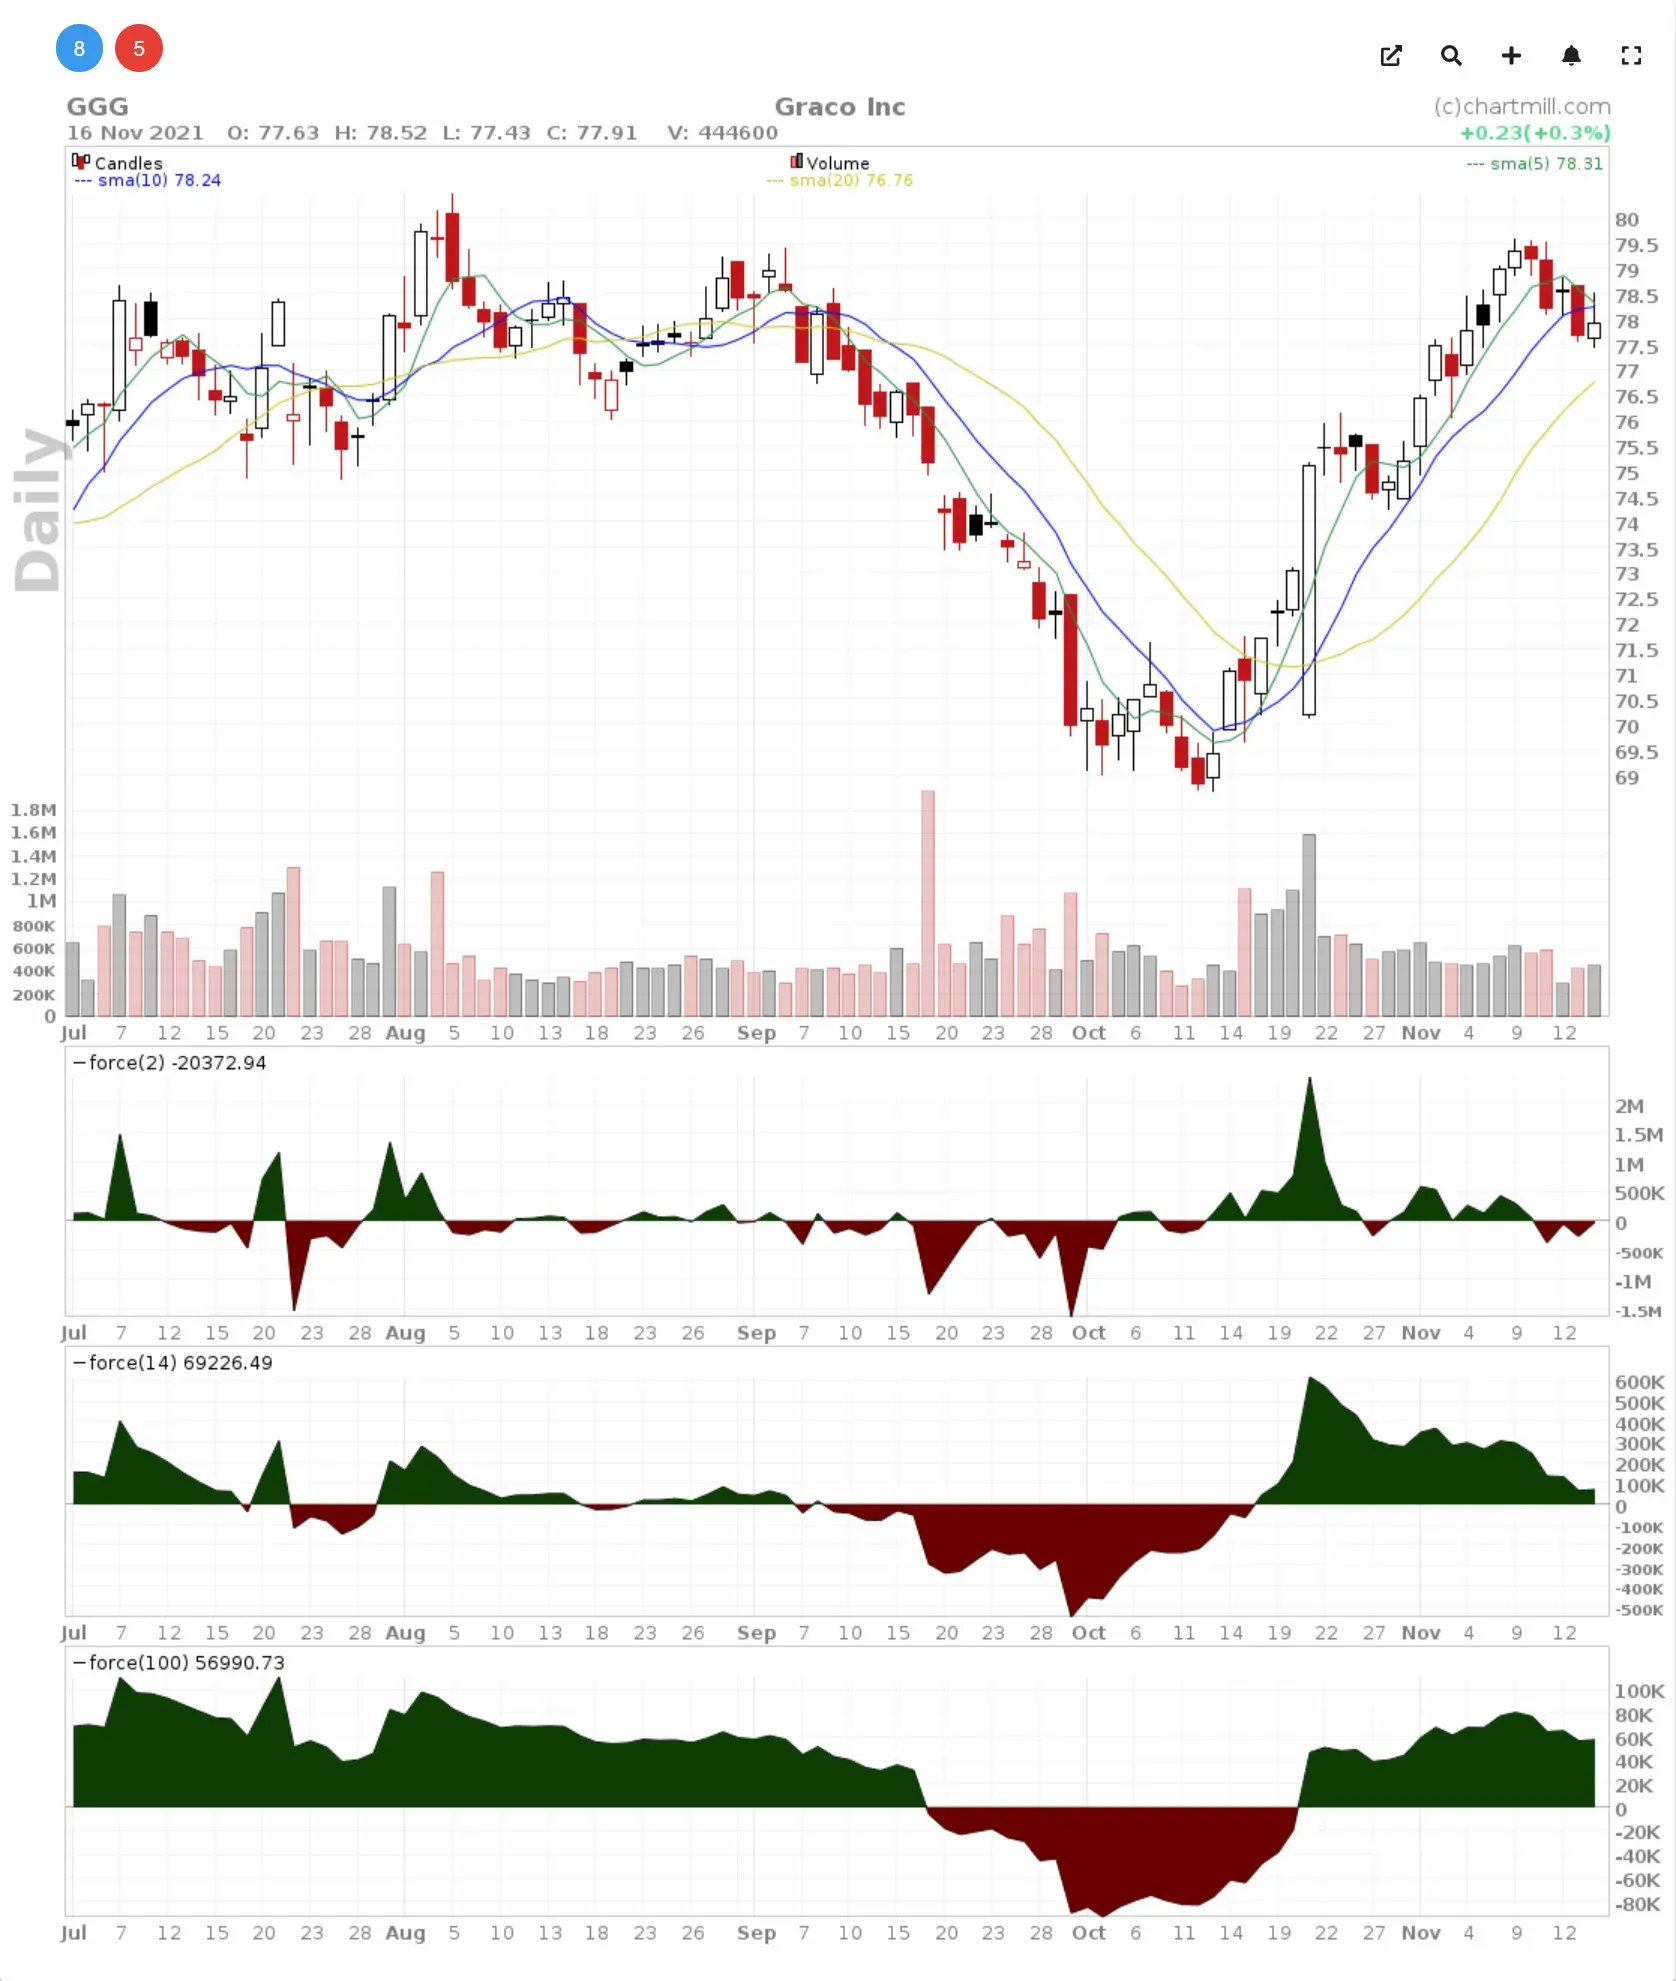
Force (14): positive | Force (100): positive | Force (2): positive
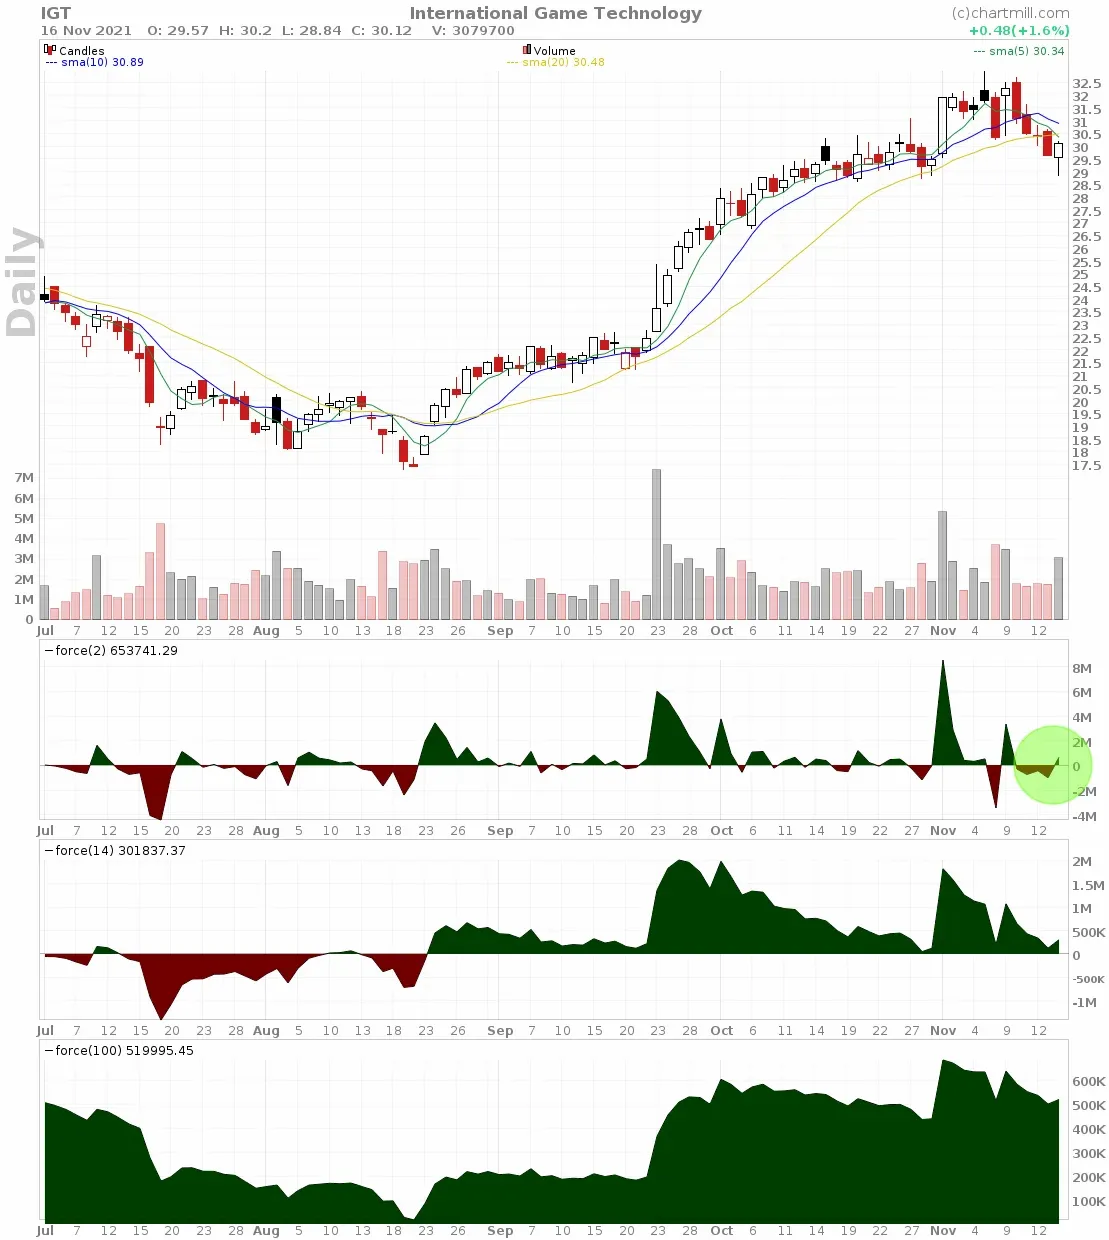
Force (14): positive | Force (100): positive | Force (2): negative
Force (14): positive | Force (100): positive | Force (2): negative
Confirmation of the setup
Keep in mind that the mere signal from the Force Index (2) indicator is not sufficient to take a position. Indicators are tools to support or reject a hypothesis. They should never be used blindly as a buy or sell signal on their own!
In technical analysis the more elements converge the greater the chance of the setup succeeding. It is therefore important to look for other relevant information which can confirm that we are possibly dealing with just a small price correction within a strong main trend. The following things are taken into consideration:
- How is the volume?
- Is the price close to support?
- Are there any recognizable price patterns?
- How far away is the next resistance?
- How does the price currently relate to the SMA5, SMA10 and SMA20?
- Are there any recognizable candlestick patterns?
- …
Here are some examples:
1: Hancock Whitney Corp (2021/10/29)
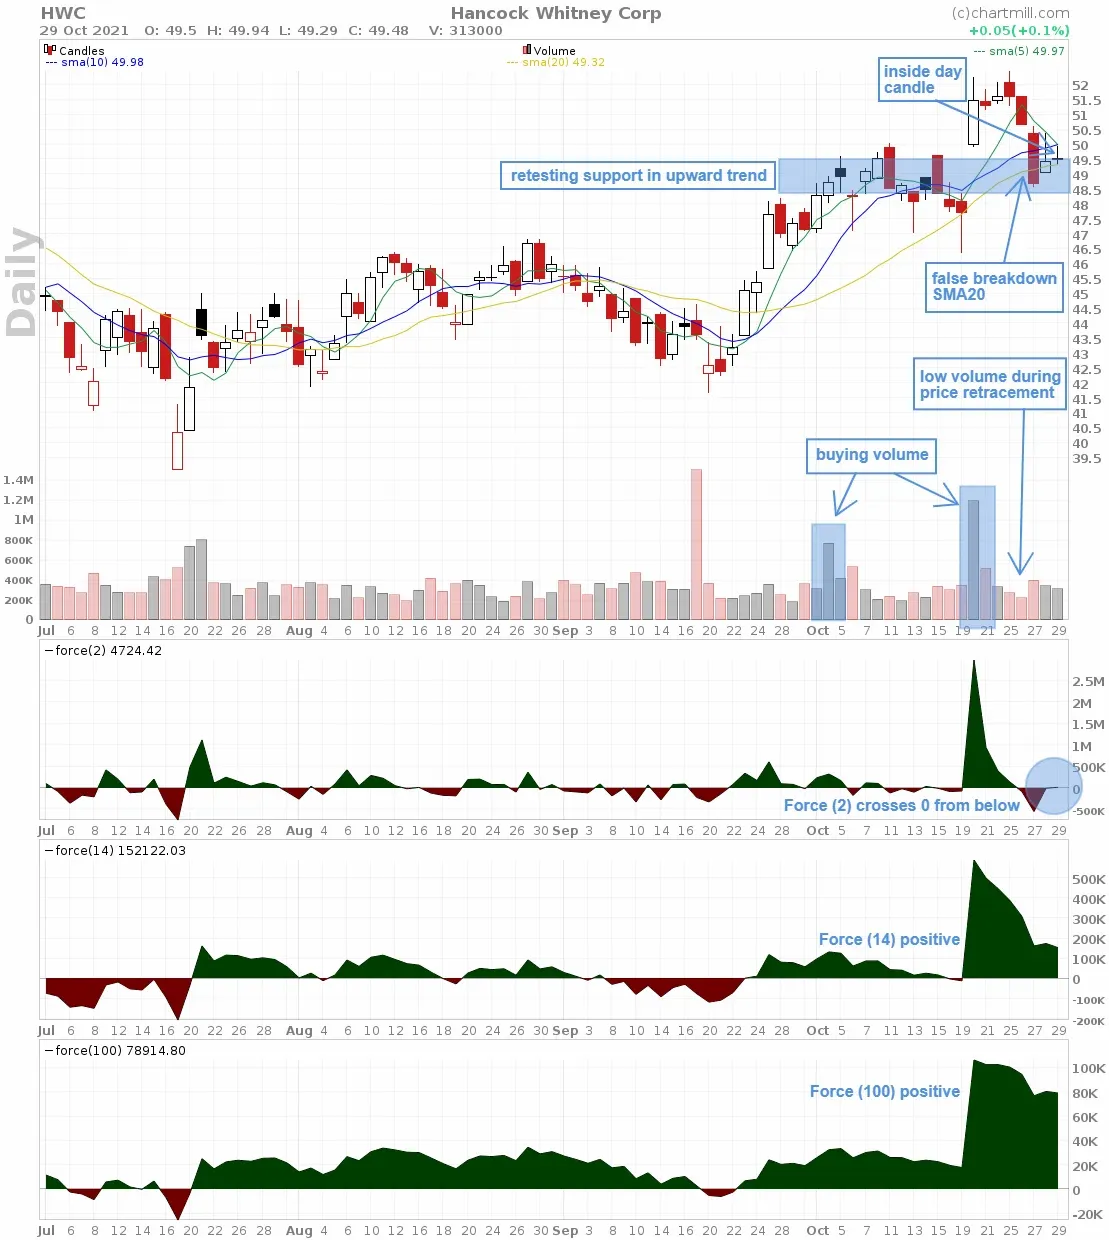
On 2021/10/20 this stock broke out of its existing trading range with huge volume and a firm gap up. Chances are that you had missed this breakout. In the meantime, however, the price dropped a bit but the seller volume remained low in the process. The last inside candle on the chart coincides with the trigger signal given by the Force Index (2) indicator. At the same time, there are quite a few other elements on the chart that show that this is indeed a potential low-risk entry. Buying from $50.45 with a short stoploss just below $48.55 is a great opportunity to capitalize on the breakout that occurred earlier.
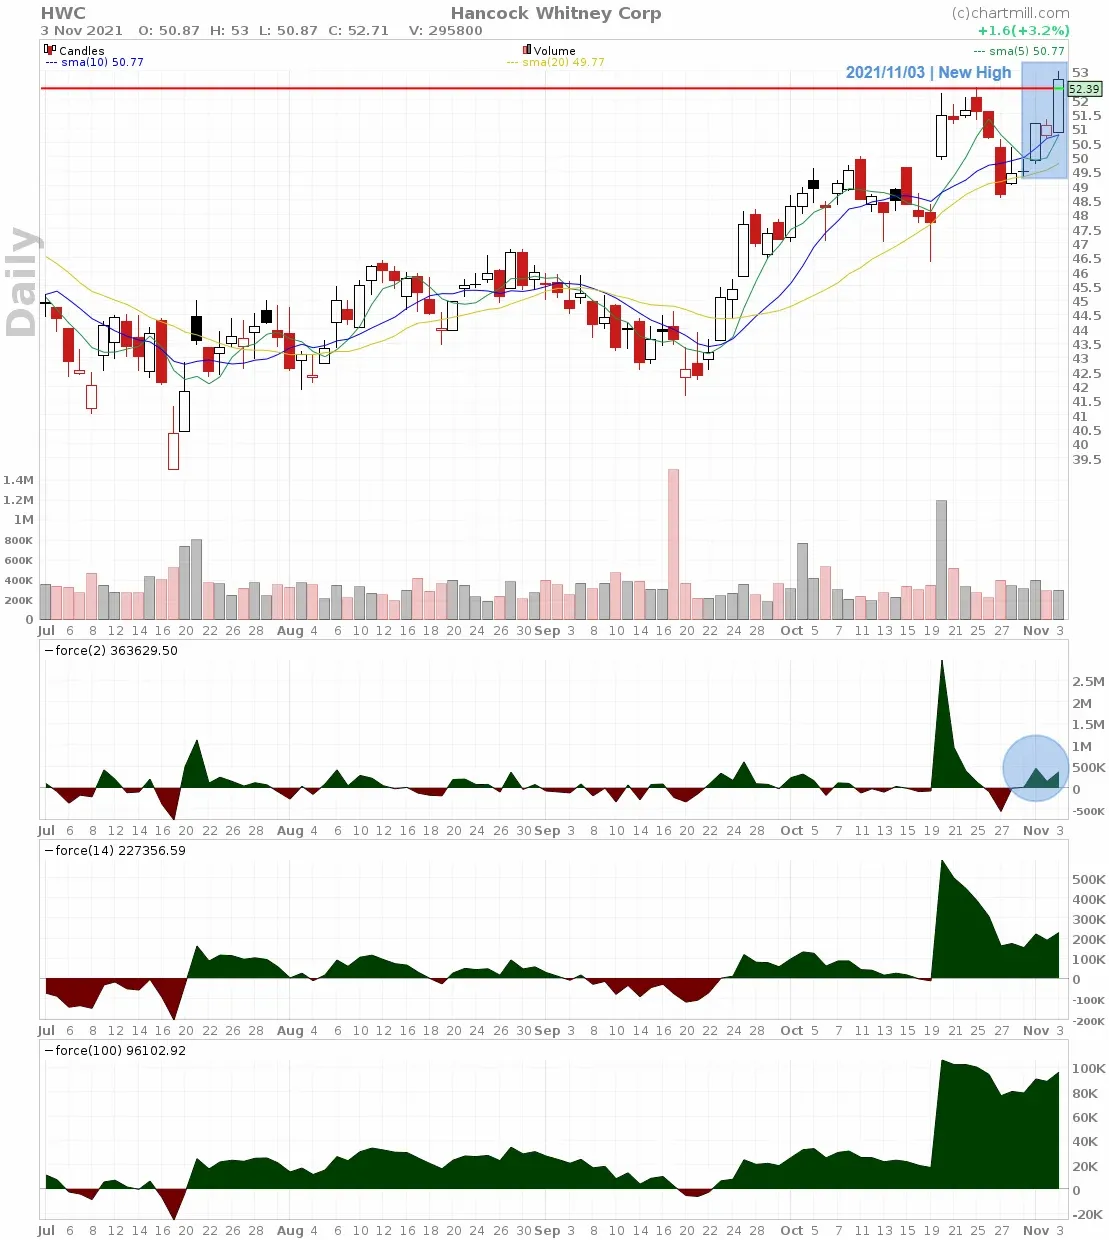
On the date of November 03, 2021, the price broke through its previous high.
2: Berry Global Group (2021/11/01)
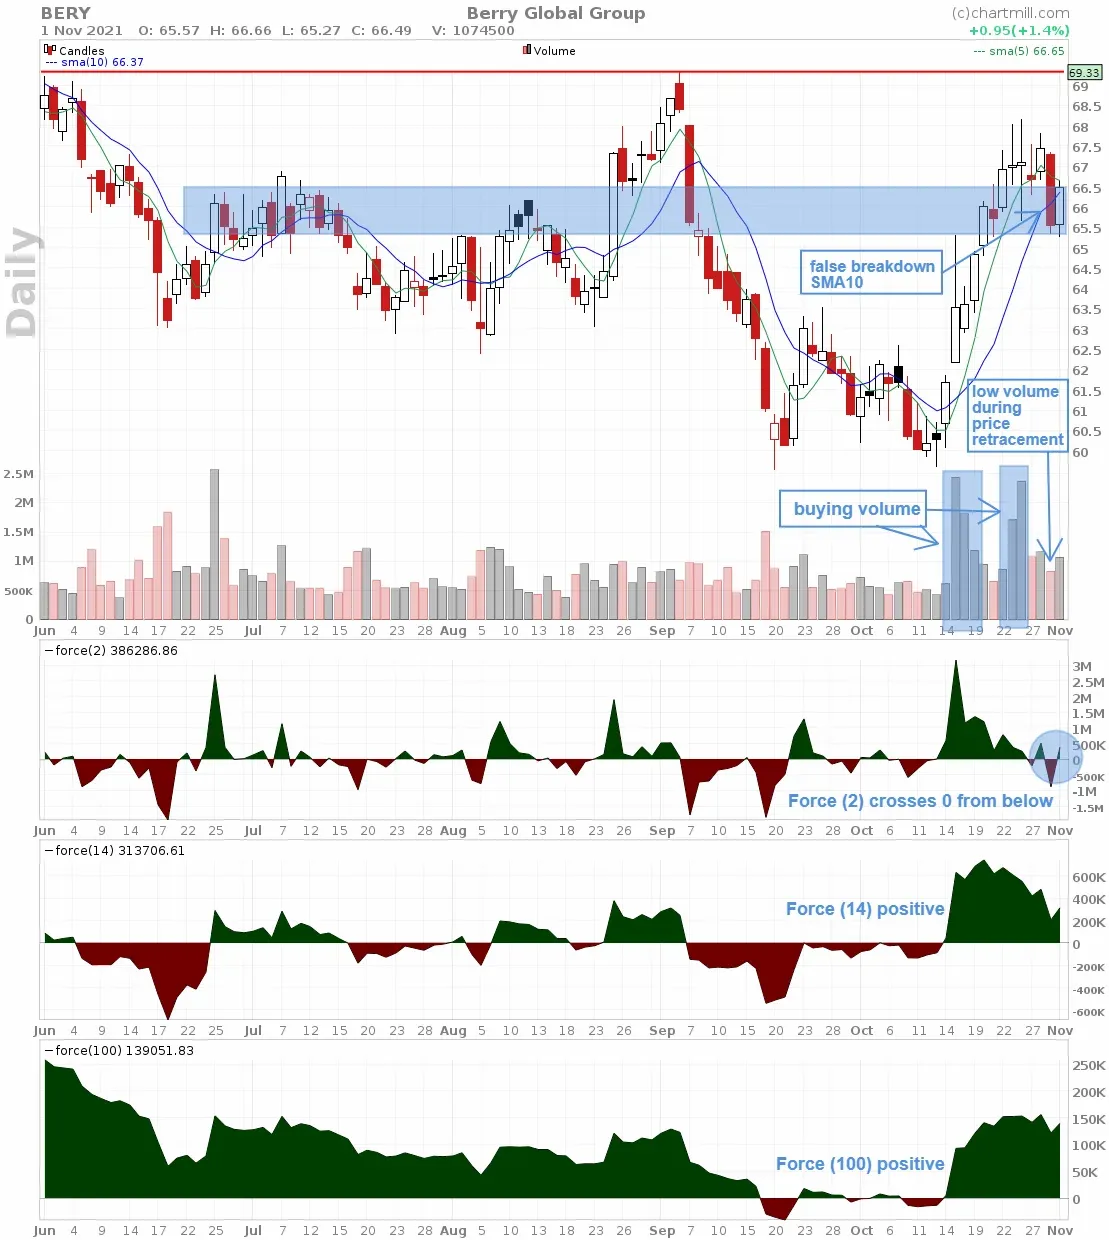
Since mid-October this stock has been rising strongly, with the price always above its SMA5. After the price moved sideways at the end of October, there was suddenly a heavy down move (long red candle) which brought the price not only below the SMA5 (green line) but also below the SMA10 (blue line). The volume was low, especially compared to the buying volume with which the earlier rise took place. This downward movement attracted early buyers and the last candle on the chart shows a rebound whereby the price again managed to close above the SMA10. It is also noteworthy that the buying volume during this upward move was greater than the selling volume during the sharp drop a day earlier.
Knowing that the top at $69.33 has some appeal as the next price target was another element that supported a low risk entry. An entry above the last white candle with a short stop below the low of the last candle, speculating on a price recovery to at least the current top was in this case a setup that could certainly be justified.
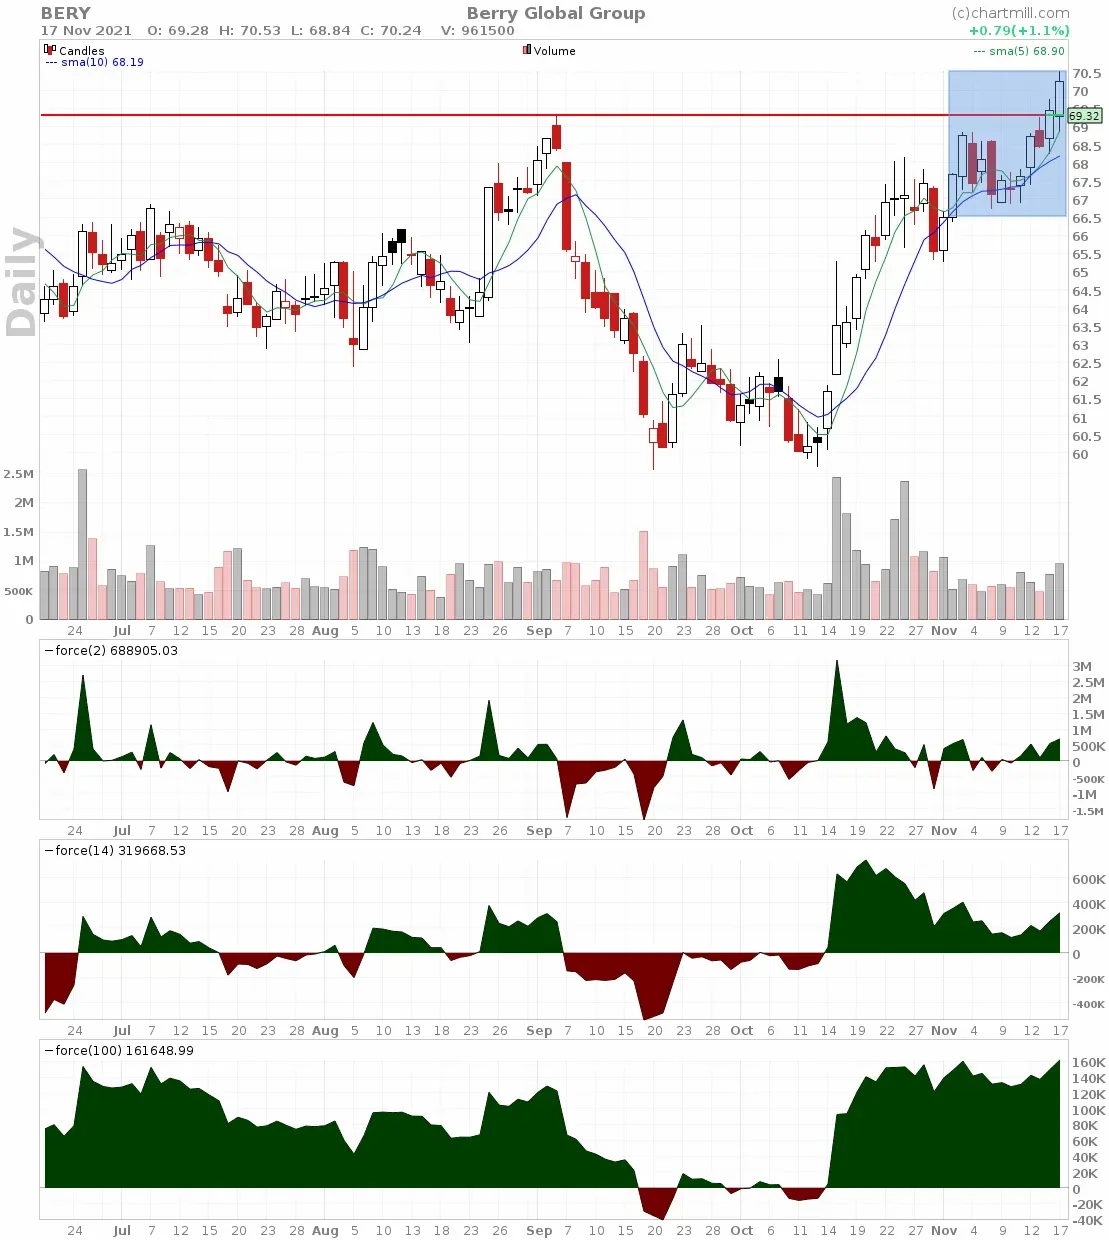
On the date of 16 November 2021 the price broke through its previous high.
Conclusion
These two separate examples show how you - by combining one technical indicator with other visual elements on the chart - can identify low risk setups that allow you to enter the market with relatively little risk.
Always keep in mind that technical indicators are just tools in a trading strategy and you need to interpret them with other converging elements that further confirm your hypothesis.