
In the world of growth investing, few methodologies have kept the lasting attraction and organized strictness of the CANSLIM strategy, created by William O’Neil. This method mixes fundamental and technical study to find high-growth market frontrunners with solid momentum. By filtering for stocks that show speeding up profits, strong yearly growth, new peaks, and institutional backing, all while matching wider market movements, investors try to seize equities set for major gains. One such firm now fitting these measures is Vertiv Holdings Co-A (NYSE:VRT), a seller of key digital infrastructure solutions.
Fundamental Positives and CANSLIM Match
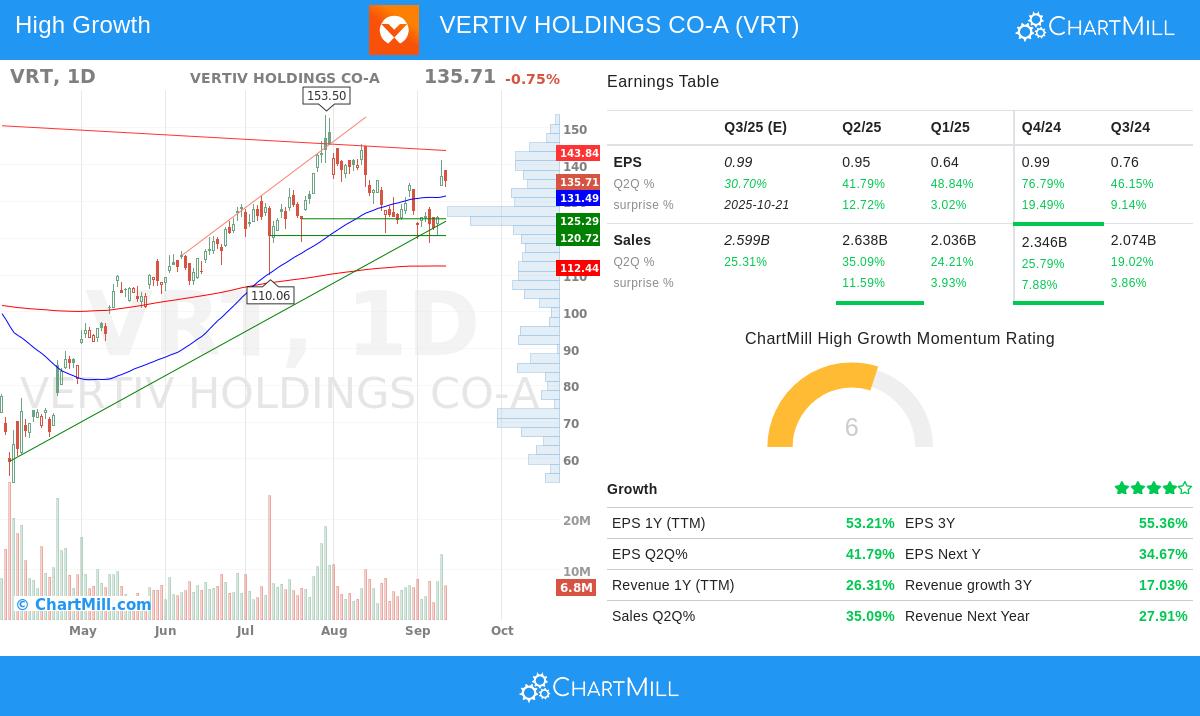
Vertiv shows multiple traits that match tightly with the CANSLIM structure’s main ideas. The method stresses current quarterly profits and sales growth, and here Vertiv does very well: its latest quarterly EPS increased by 41.79% year-over-year, while revenue grew by 35.09%. These numbers not only hit but go past the strategy’s usual limits, pointing to solid operational speed. This kind of speeding up is key since it frequently comes before ongoing outperformance, as noted in O’Neil’s lessons.
Yearly profits gains are another base of the method. Vertiv’s three-year EPS growth is at a notable 55.36%, much over the 25% minimum commonly wanted by CANSLIM followers. This steady record shows the firm isn’t depending on single events but has built growth into its operating model. Also, with a return on equity (ROE) of 25.99%, Vertiv displays effective use of shareholder money, strengthening the “A” measure of continued yearly high quality.
Supply and demand forces, captured in the “S” of CANSLIM, center on share setup and debt amounts. Vertiv keeps a debt-to-equity ratio of 0.93, under the cautious limit of 2, showing a even method to funding that doesn’t over-borrow the operation. This backs financial steadiness and lowers risk in market drops. At the same time, institutional ownership is at 80.87%, under the 85% top level suggested to prevent packed trades, but high enough to show professional investor trust.
Technical and Market Placement
From a technical view, Vertiv has a relative strength rating of 88.56, meaning it beats almost 89% of all stocks—a straight hit to the “L” (Leader) measure, which looks for market-leading equities instead of weaker ones. This force is framed by a mostly positive market setting, with the S&P500 displaying both short- and long-term rising trends, meeting the “M” (Market Direction) part of CANSLIM that suggests investing mainly in rising markets.
The technical analysis report notes a rating of 7 out of 10, pointing to solid medium-term results even with recent swings, while the fundamental analysis report gives a close score, complimenting high profitability, growth, and financial soundness. These reports together highlight a company that is not only growing fast but also keeping operational control.
Ending and More Study
Vertiv Holdings stands as a strong candidate for investors using the CANSLIM strategy, due to its forceful profits growth, good financials, frontrunner status in its field, and match with present market states. While no investment is free from risk, and recent price swings suggest thoughtful entry timing, the basic fundamentals and technical signs back a hopeful view.
For those keen to review other stocks that meet close measures, our pre-set CANSLIM screener gives a active list of high-growth candidates refreshed in real-time. This tool can aid investors in finding other possible frontrunners in line with O’Neil’s proven ideas.
Disclaimer: This article is for informational purposes only and does not constitute investment advice. Investors should conduct their own research and consider their financial situation, risk tolerance, and investment objectives before making any decisions.