
A Mixed Start to the Week for US Markets
US stocks kicked off the new trading week on a sour note, with major indices retreating from recent highs. The S&P 500 slipped 0.6%, ending a nine-day winning streak, while the Nasdaq lost 0.7% and the Dow Jones edged down 0.2%.
Although technical indicators remain bullish, investors are growing increasingly cautious in light of global trade tensions and political uncertainty.
Buffett’s Retirement Sends Shockwaves Through the Market
A major headline Monday was Warren Buffett’s surprise announcement that he will step down as CEO of Berkshire Hathaway at the end of 2025, after six decades at the helm.
While the decision was not entirely unexpected? especially after the death of Charlie Munger, many investors were caught off guard by the timing. Shares of Berkshire Hathaway (BRK.B | -5.12%) fell over 5%, erasing roughly $50 billion in market value.
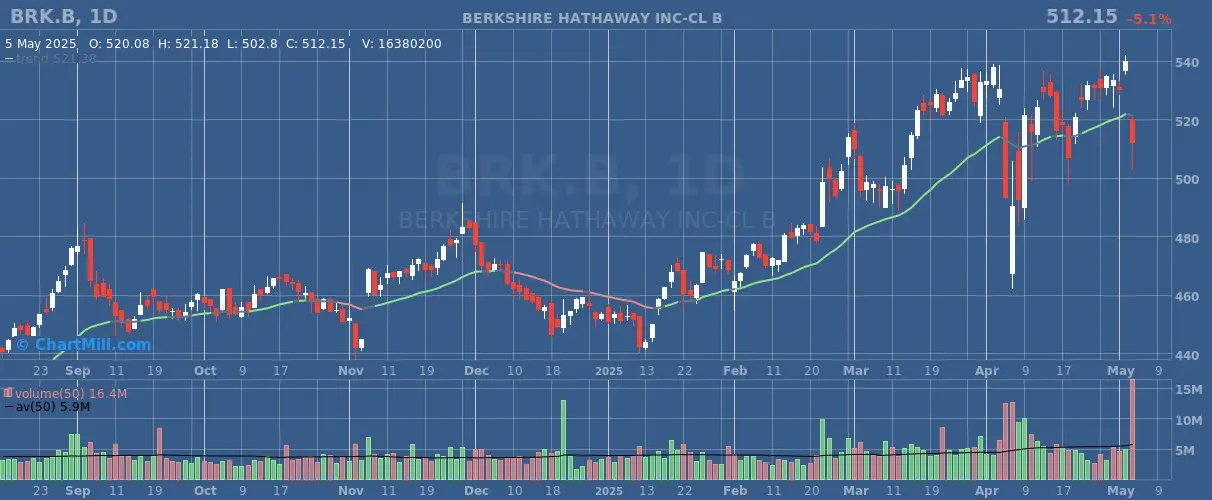
Greg Abel, long viewed as Buffett’s successor, will take over leadership. Most analysts expect continuity in strategy and corporate culture, with UBS noting, “The timing was somewhat surprising, but the succession plan itself is well understood. Operationally, little change is expected.”
Berkshire’s Q1 earnings also contributed to investor unease. Operating profit dropped 14% year-over-year to $9.6 billion, largely due to weaker performance in the insurance segment, affected by rising costs tied to California wildfires. Net income halved to $4.6 billion.
Still, the company’s cash reserves swelled to a record $348 billion—yet Buffett signaled no urgency to deploy it, citing a lack of suitable opportunities.
Trade Policy and Fed Uncertainty Add to Caution
Investors also kept a close eye on trade developments and the upcoming Federal Reserve policy decision. U.S. Treasury Secretary Scott Bessent and President Donald Trump both hinted at the imminent signing of new trade deals. At the same time, Trump criticized Fed Chair Jerome Powell for not cutting interest rates, though he confirmed Powell would serve out his full term.
The Fed is expected to maintain its benchmark interest rate between 4.25% and 4.50% at its upcoming meeting. ING economist James Knightley noted that inflation concerns are limiting the Fed’s flexibility, but a cooling economy could pave the way for cuts in the second half of the year.
Adding to trade-related anxiety, Trump approved a 100% import tariff on foreign-made films in a bid to protect the U.S. film industry. The potential ripple effects on streaming and theatrical releases remain unclear.
Commodities Show Volatility
OPEC+ announced over the weekend that it will raise oil production by 400,000 barrels per day starting in June, as part of a broader plan to gradually unwind previous cuts. In response, crude oil prices fell more than 2%, hitting their lowest level in over four years. This added to uncertainty in global markets.
Conversely, gold prices surged 3.1% to $3,344 per ounce, reflecting a flight to safety. Meanwhile, bond yields edged up ahead of the Fed’s decision, and the euro rose to $1.1317 against the dollar.
Winners and Losers on Monday
Despite the broader pullback, some stocks managed to shine.
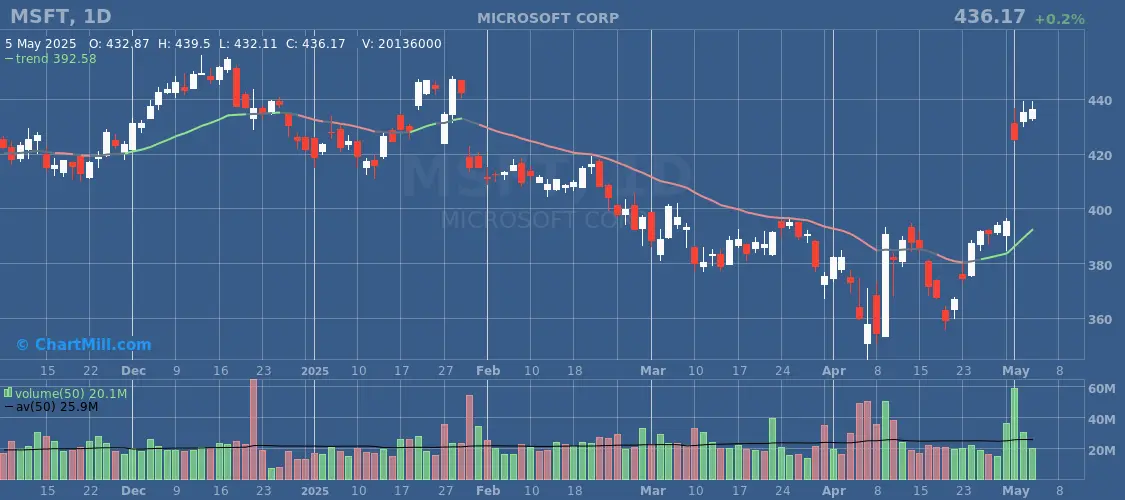
Microsoft (MSFT | +0.2%) ticked up 0.2%, securing its place as the most valuable U.S. company by market cap, overtaking Apple.
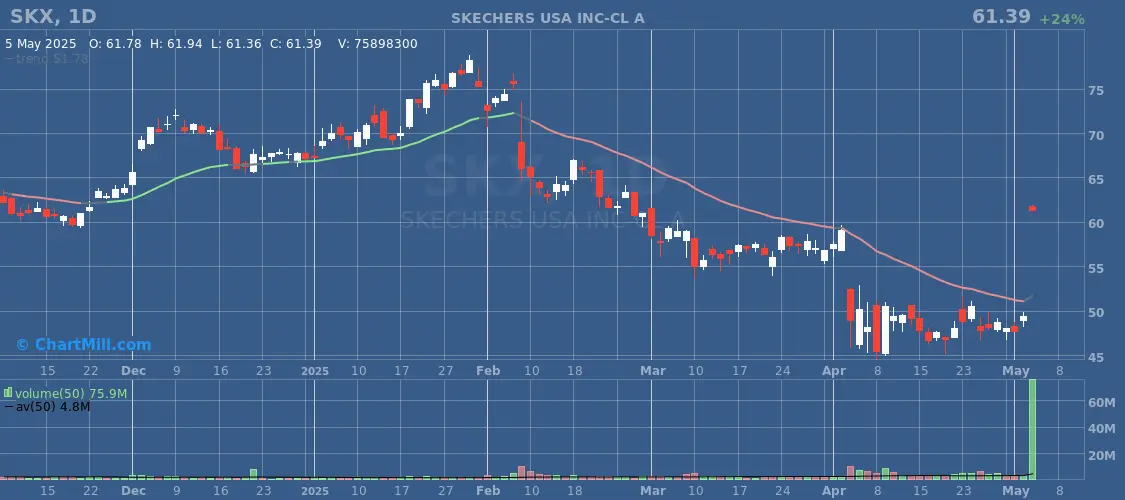
Skechers (SKX | +24.35%) surged nearly 25% after announcing a $9.4 billion go-private deal with 3G Capital.
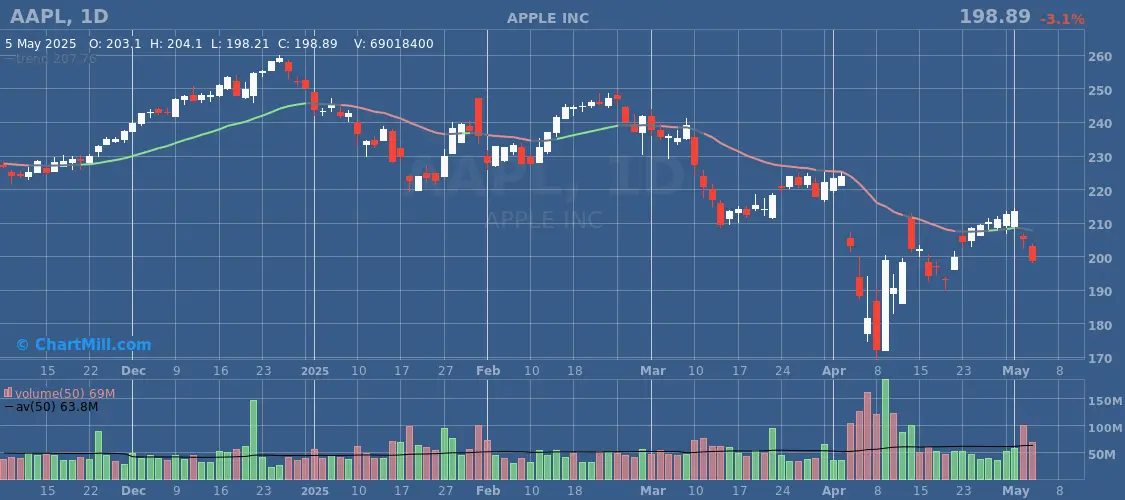
On the downside, Apple (AAPL | -3.15%) continued its losing streak, falling 3.2% amid disappointing service revenue and concerns over China.
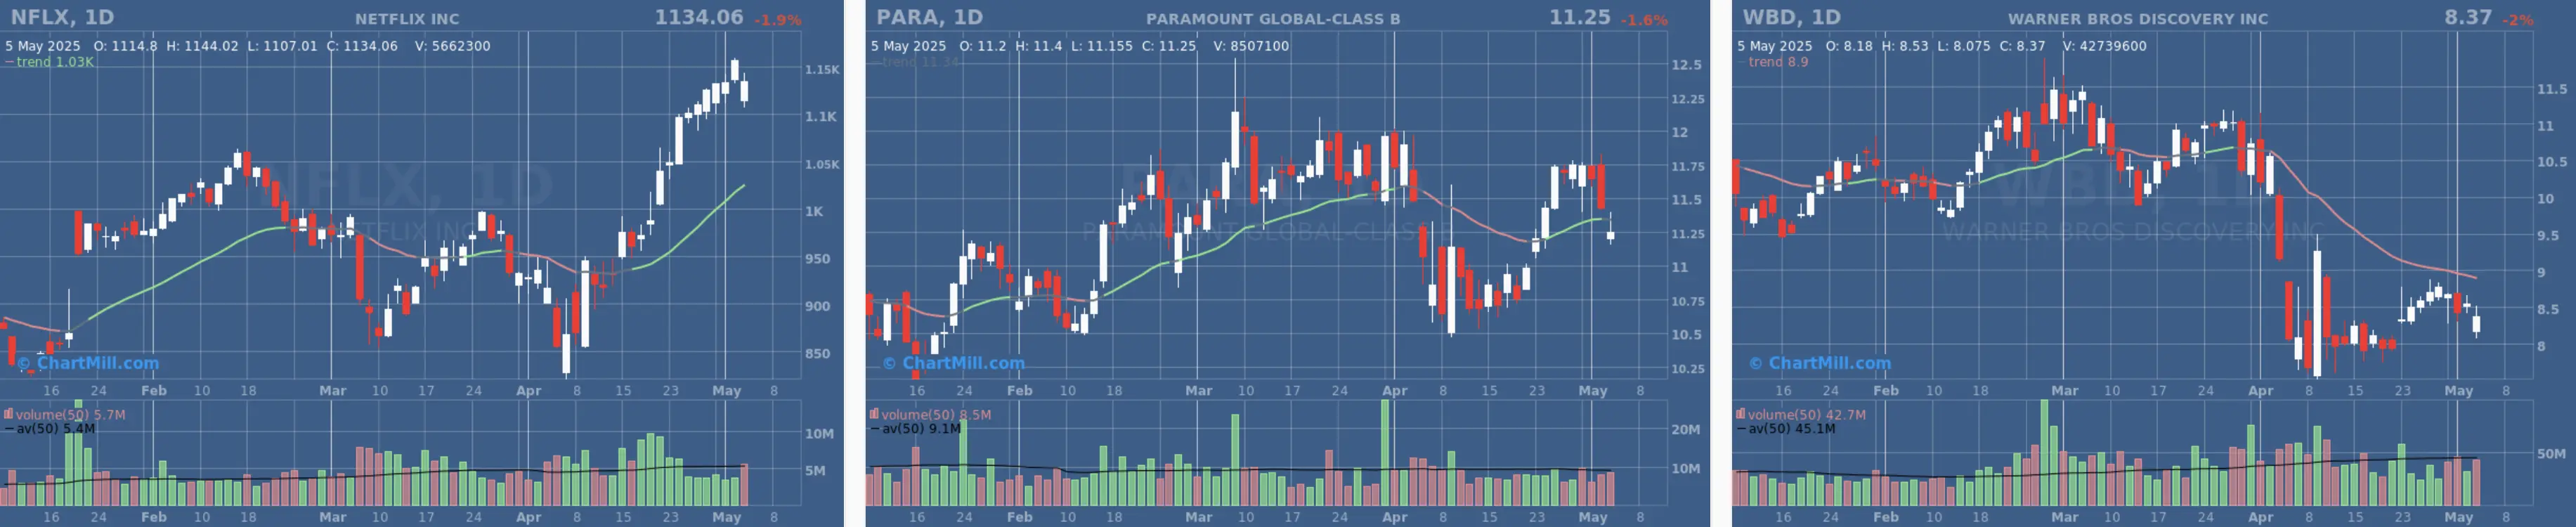
Streaming-related stocks also took a hit following Trump’s film tariff announcement: Netflix (NFLX | -1.94%), Paramount Global (PARA | -1.57%), and Warner Bros. Discovery (WBD | -1.99%) were among the decliners.
Conclusion
Wall Street began the week under pressure, with Buffett’s retirement, earnings misses, trade uncertainty, and geopolitical tensions all contributing to a cautious market sentiment.
As investors await the Fed’s next move and clarity on trade policy, volatility is likely to persist in the days ahead.
Daily Market Analysis – May 2, 2025 (After Market Close)
Short Term Trend
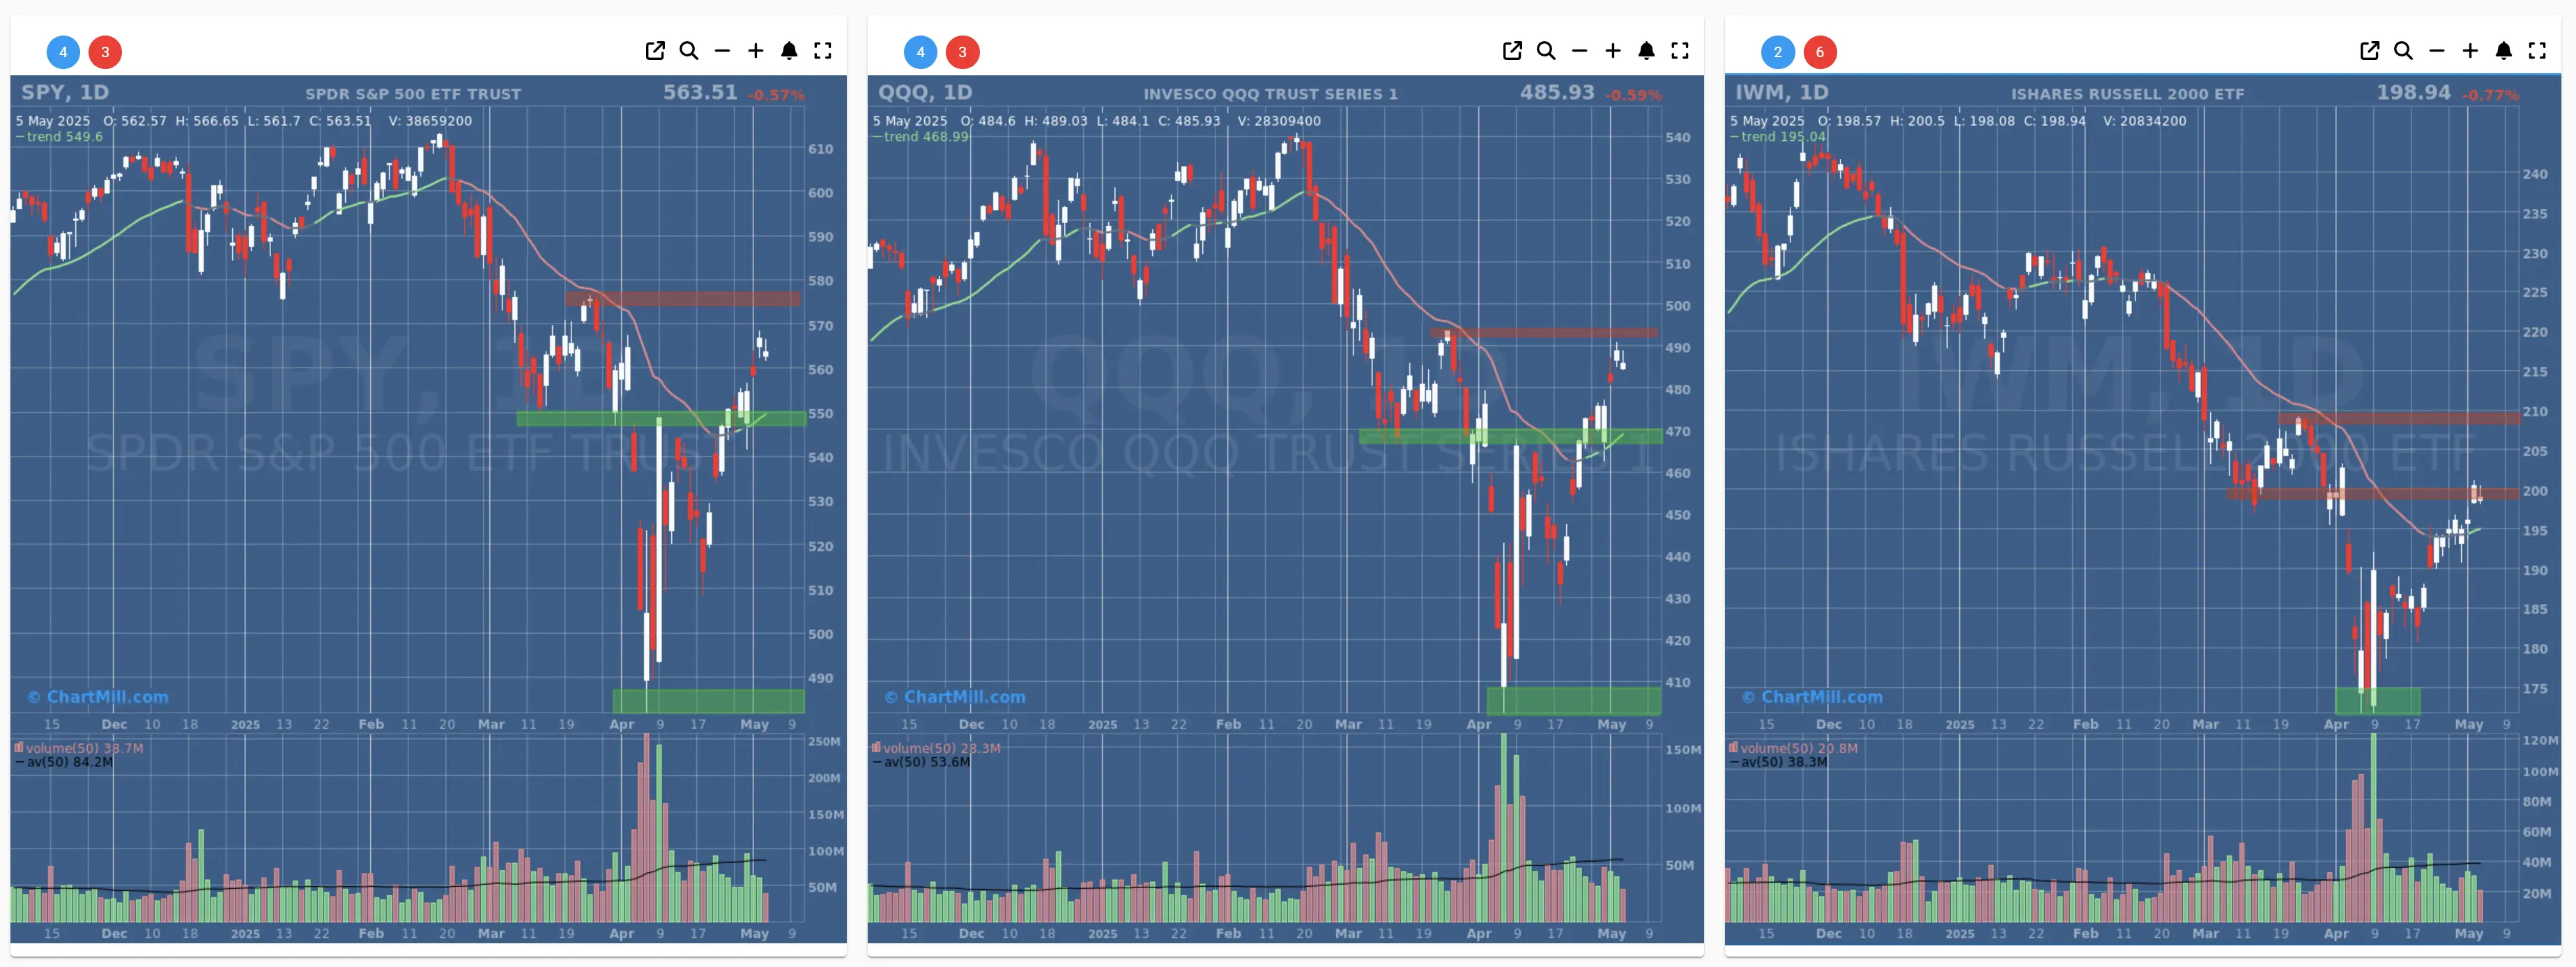
- Short-Term Trend: Bullish (no change)
- Support at $490 - $550
- Resistance at $580
- Volume: Significant below average (50)
- Pattern: Doji Candle
- Short-Term Trend: Bullish (no change)
- Support at $470
- Resistance at $490
- Volume: Significant below average (50)
- Pattern: Doji Candle
- Short-Term Trend: Bullish (no change)
- Support at $195
- Resistance at $210-215
- Volume: Significant below average (50)
- Pattern: Doji Candle
Long Term Trend
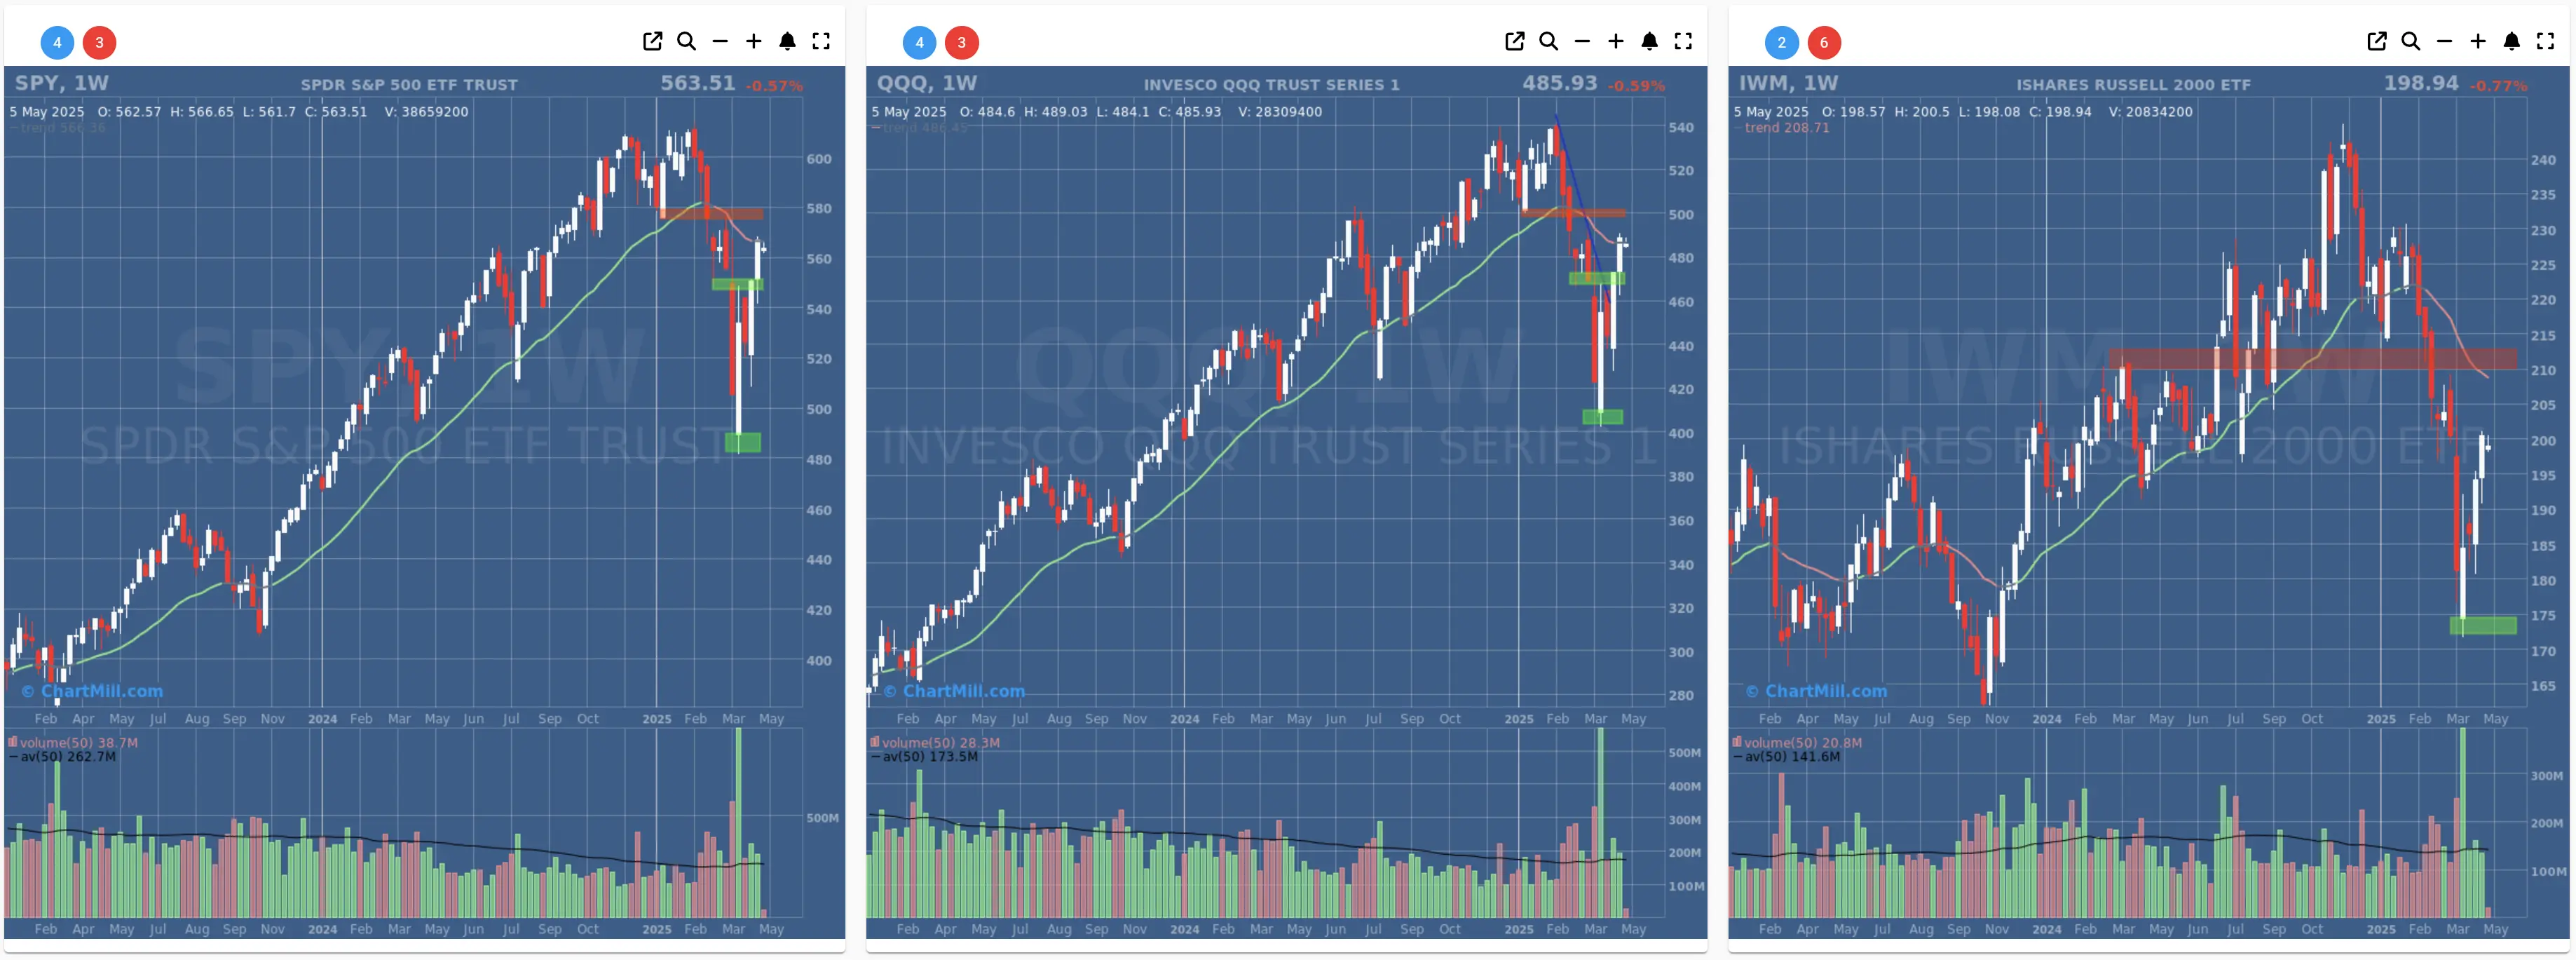
- Long-Term Trend: Neutral (no change)
- Long-Term Trend: Neutral (no change)
- Long-Term Trend: Down (no change)
Market Breadth Analysis for May 5, 2025 (After Market Close)
Market Breadth Weakens: Is the Rally Losing Steam?
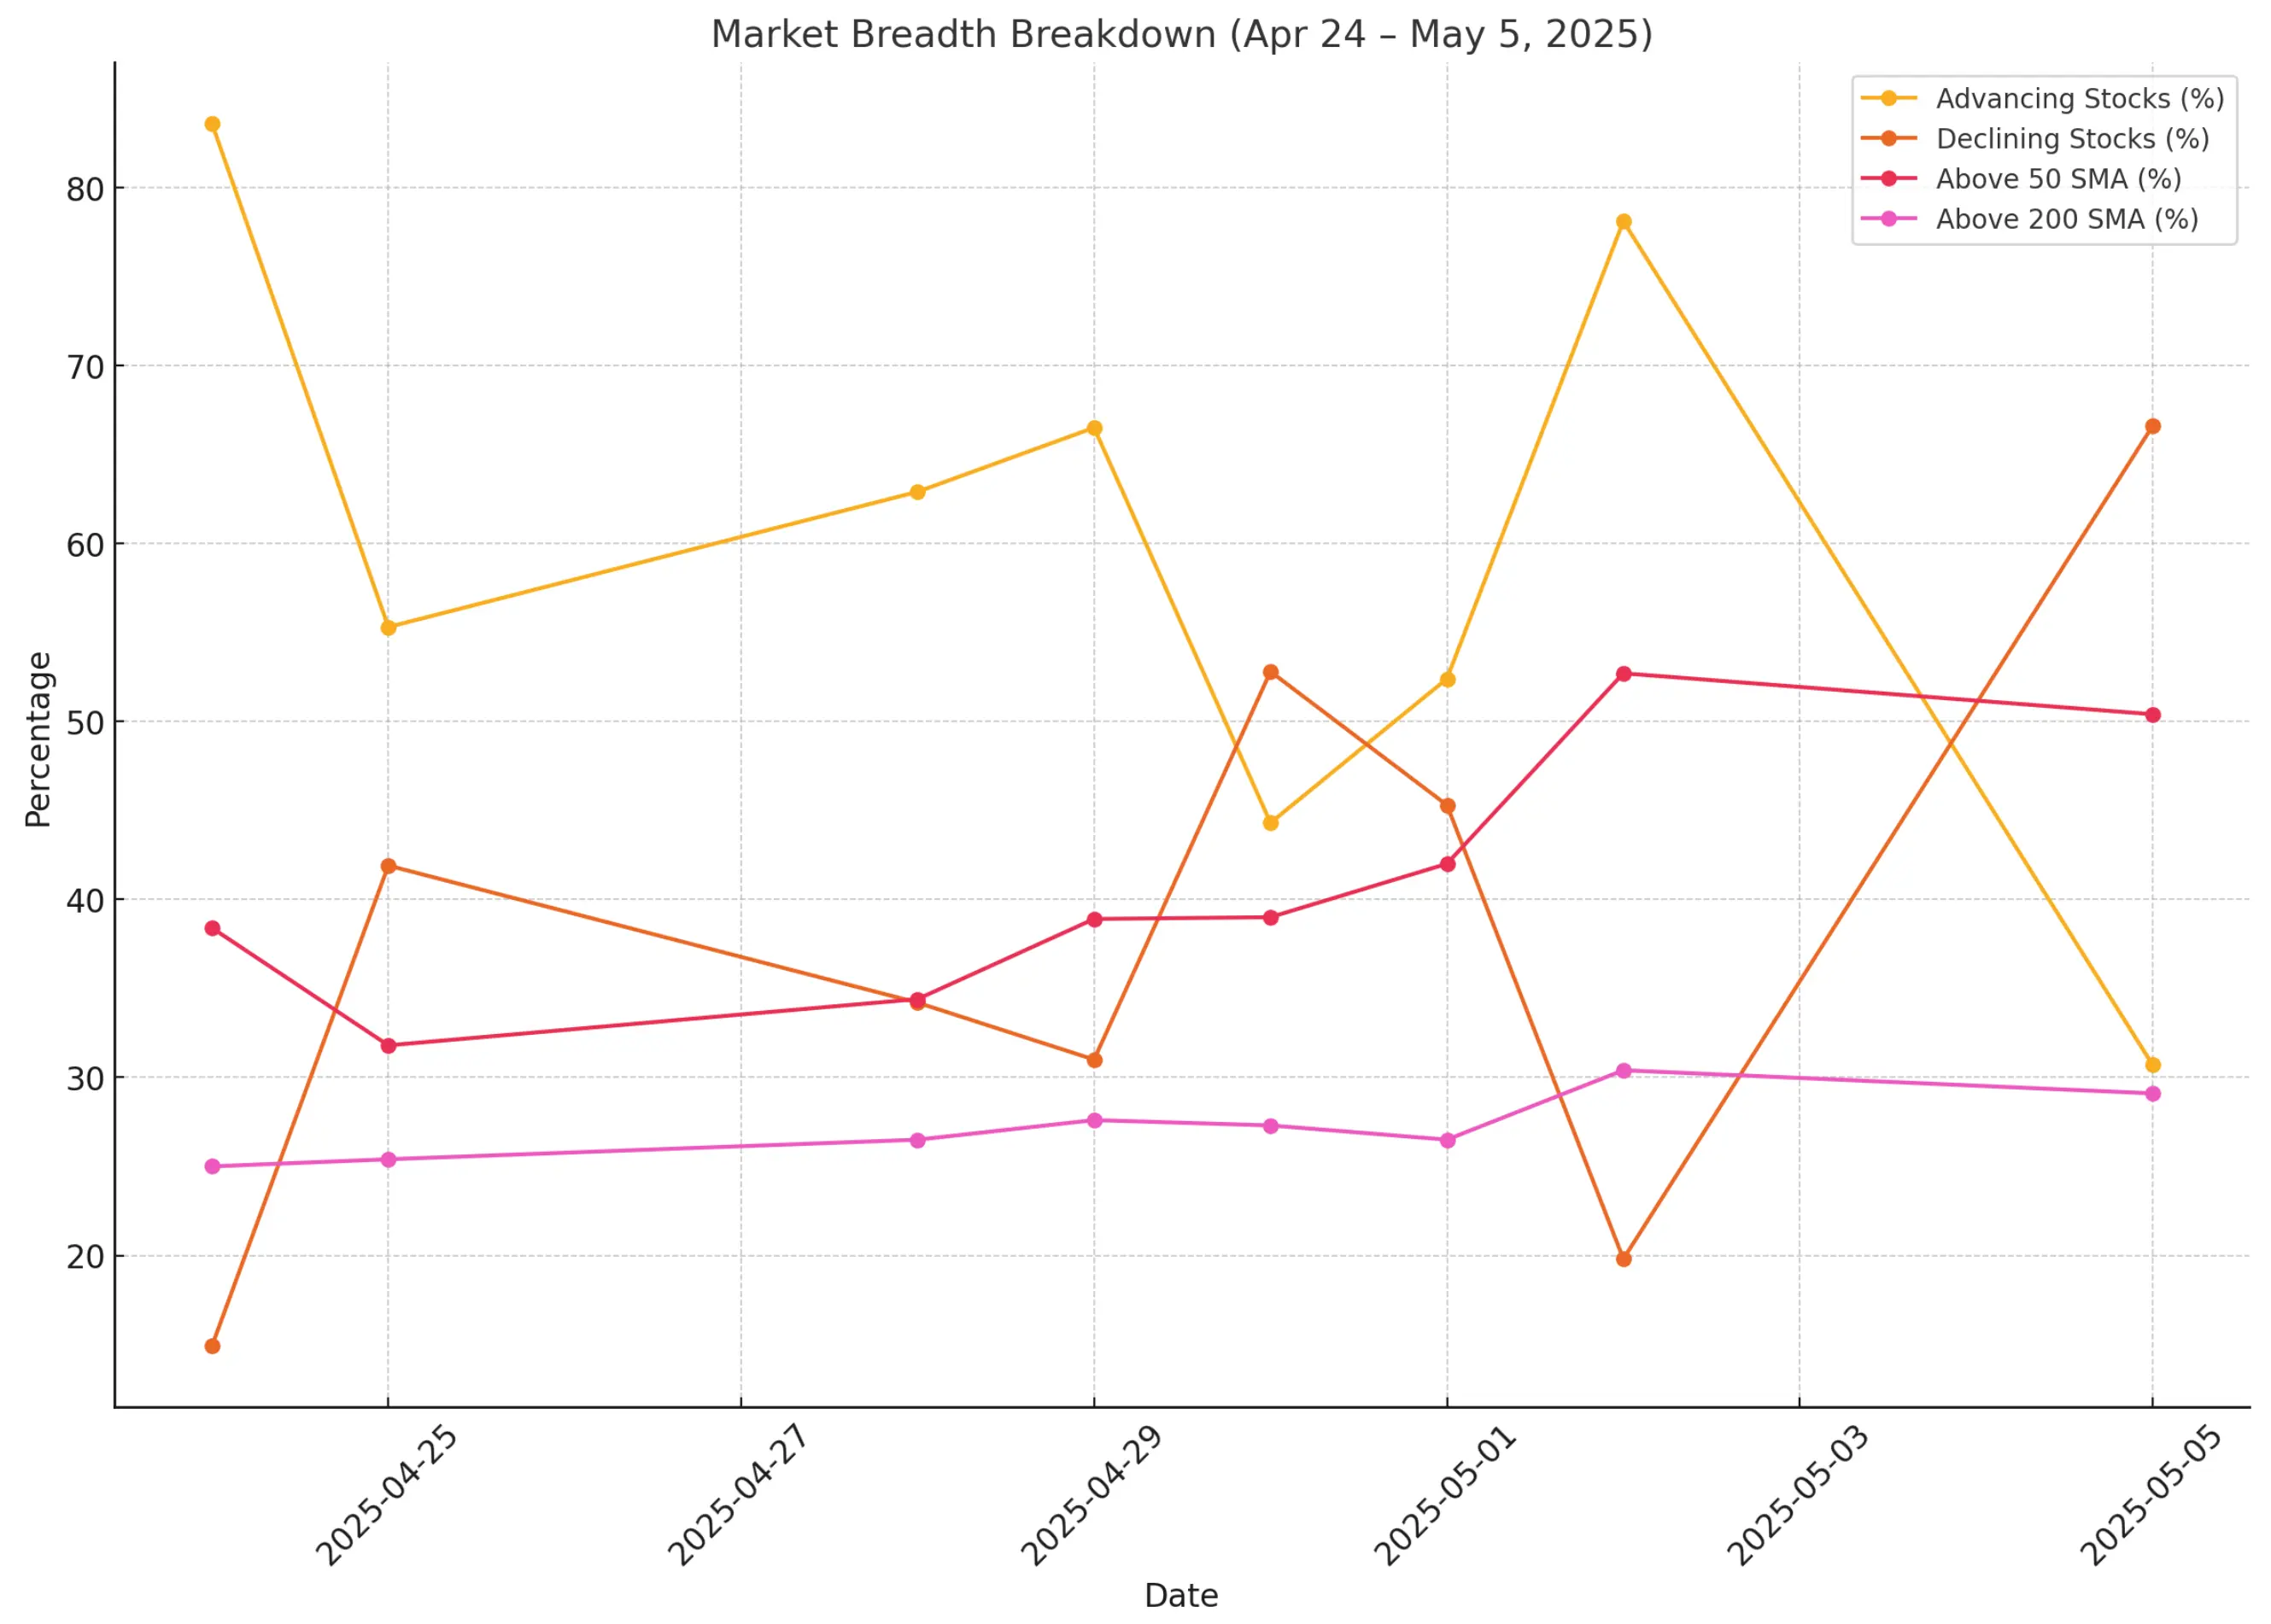
While major US indices remain near highs, a deeper look under the surface reveals a different story. Market breadth data for the period from April 24 to May 5, 2025, suggests growing fragility. Fewer stocks are participating in the rally, and signs of exhaustion are beginning to emerge.
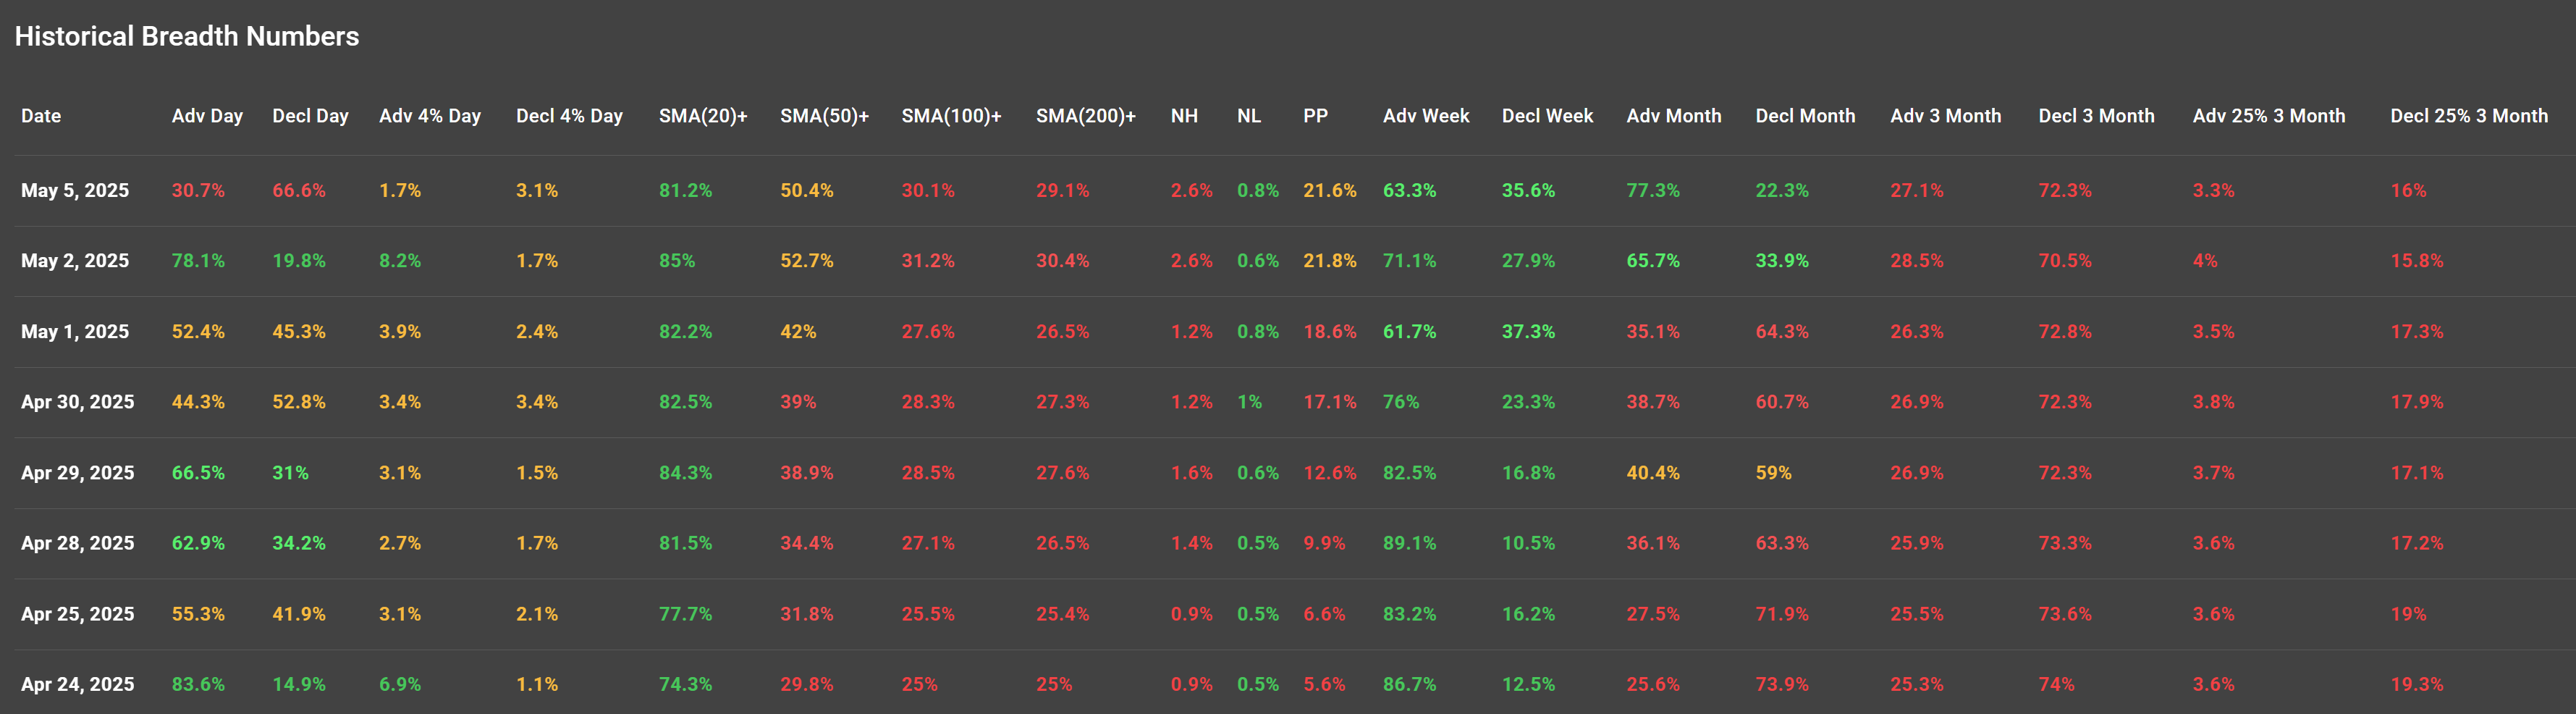
Broad Declines on May 5 Signal Weakness
On May 5, just 30.7% of stocks advanced, while a significant 66.6% declined — a sharp reversal from the strong 78.1% advancing rate on May 2. This shift marks a return to risk-off sentiment and ended what appeared to be a short-term bounce in market participation.
The number of stocks making 4%+ moves was also low, with only 1.7% gaining and 3.1% losing that much. This lack of strong upside momentum highlights the market's hesitancy to follow through on breakouts.
Momentum Cracks in Medium and Long-Term Trends
Despite a strong short-term reading on the SMA(20)+ indicator (81.2% of stocks remain above their 20-day moving average), longer-term breadth tells a more concerning story:
-
SMA(50)+: Dropped to 50.4%
-
SMA(100)+: Just 30.1%
-
SMA(200)+: A mere 29.1%
The fact that less than one-third of stocks are trading above their 100- and 200-day moving averages shows that the broader market structure remains weak, even as headline indices hold up.
Percentage of Stocks Above Pivot Points Hits Lows
Another key metric, the Percentage of Stocks Above Pivot Point (PP), fell to 21.6% — among the lowest readings in recent weeks. This further confirms that the average stock is no longer keeping pace with the broader market.
Breadth Trends Across Timeframes
Weekly Trends (as of May 5):
-
Advancing Week: 63.3% (down from 89.1% on Apr 28)
-
Declining Week: 35.6%
Monthly Trends:
-
Advancing Month: Still strong at 77.3%, but momentum is slowing
-
Declining Month: Rising at 22.3%
3-Month Trends:
-
Advancing 3-Month: 27.1%
-
Declining 3-Month: 72.3%
These longer-term readings reflect bearish divergence — a majority of stocks have been trending down over the past quarter, even as large-cap indexes continue to post gains.
What Does This Mean for Traders and Investors?
The headline indices may still look healthy, but breadth deterioration is a red flag. When fewer and fewer stocks participate in upward moves, the market becomes increasingly vulnerable to sharp pullbacks.
Traders should consider:
-
Tightening stops on recent winners
-
Rotating into relative strength leaders still above key SMAs
-
Being cautious with new long entries until breadth improves
Long-term investors may want to focus on quality names holding above their 50- and 200-day SMAs — and stay defensive while broader participation remains weak.
Conclusion
Market internals have clearly weakened. Breadth peaked in late April and has since reversed sharply. While this isn’t a call for imminent disaster, it does suggest underlying risk is rising. Unless a new wave of broad-based buying emerges, volatility may increase, and leadership may narrow further.
Keep an eye on the internals — they often turn before the indices do.