
Investors looking for long-term growth possibilities at fair prices frequently use established methods like the one created by Peter Lynch. The former Fidelity Magellan Fund manager recorded excellent results by concentrating on businesses with lasting earnings growth, sound financial condition, and fair prices. His method highlights fundamental review instead of market prediction, looking for companies that show steady results without high debt or unstable growth levels. This thinking matches well with Growth at a Reasonable Price (GARP) investing, which mixes growth possibility with price control.
Financial Condition and Earnings
Dr. Reddy's Laboratories (NYSE:RDY) shows a number of traits that fit with Lynch's investment ideas. The company keeps outstanding financial condition with very little debt, a main factor for long-term investors wanting steadiness.
- Debt-to-Equity Ratio: 0.03 (much lower than Lynch's chosen limit of 0.25)
- Current Ratio: 1.85 (showing enough short-term cash availability)
- Return on Equity: 16.03% (surpassing the 15% lowest Lynch standard)
- Return on Invested Capital: 13.03% (placed with the best in its field)
These numbers show a business that pays for activities mainly through ownership instead of debt, keeps good cash levels, and produces high returns for owners. Lynch stressed this kind of financial steadiness as important for handling economic changes without hurting business soundness.
Lasting Growth Pattern
The pharmaceutical business's past growth trend matches Lynch's liking for lasting increase instead of sharp but possibly short growth periods. The filtering rules specifically look for businesses with earnings growth between 15-30% to prevent unstable company plans.
- 5-Year EPS Growth: 23.62% (inside the 15-30% aimed range)
- Recent Sales Growth: 14.04% (showing continued business growth)
- Profit Margin: 16.82% (placed in the top ten percent of pharmaceutical companies)
This steady past performance indicates the company has built a repeatable business plan instead of depending on short-term market situations. While future EPS estimates show some slowing, the company keeps positive sales growth outlooks, fitting with Lynch's focus on long-term business basics instead of three-month changes.
Price Assessment
Lynch's method gives great importance to price through the PEG ratio, which matches a company's P/E ratio to its growth level. A PEG ratio under 1 indicates a company might be priced low compared to its growth chances.
- PEG Ratio: 0.73 (much lower than the aimed level of 1.0)
- P/E Ratio: 17.19 (less expensive than 85% of field companies)
- Enterprise Value/EBITDA: Good field position
The appealing PEG ratio shows that even with strong past growth, the market has not completely valued this performance in the stock's price. This makes the "fair price" part needed for GARP investors, giving possible gain while keeping a safety buffer.
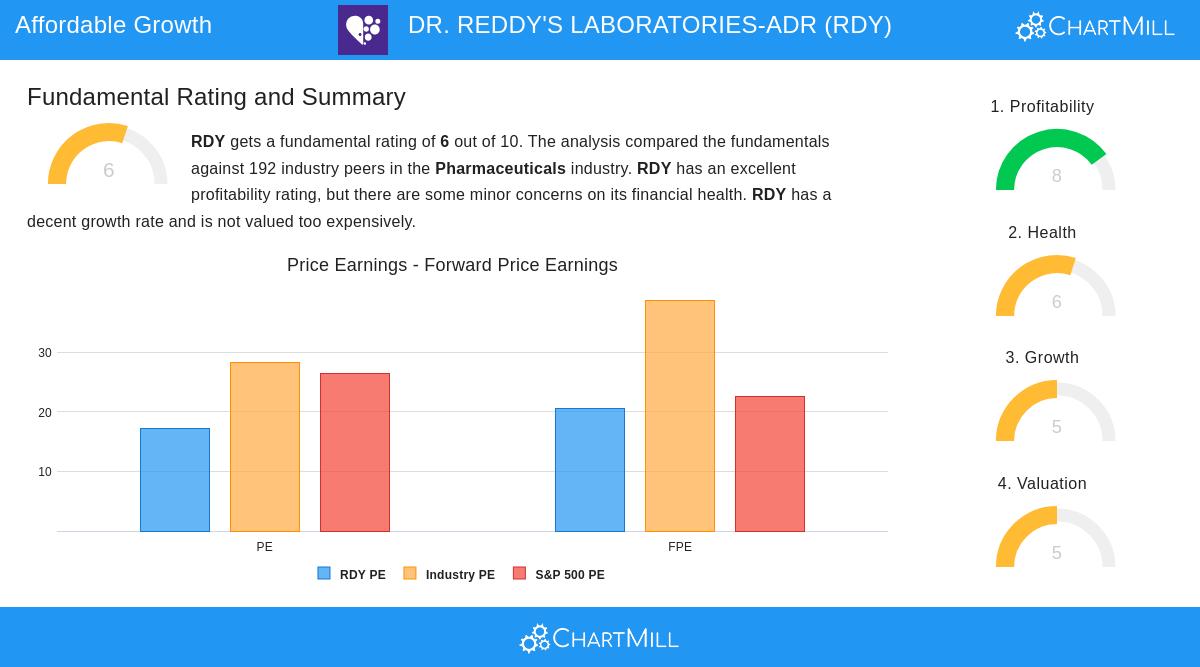
Fundamental Review Summary
According to ChartMill's detailed fundamental review, Dr. Reddy's Laboratories gets a good rating of 6 out of 10. The company shows superb earnings measures, scoring 8 out of 10 in this group, with high returns on assets, equity, and invested capital all placed in the top quarter of pharmaceutical businesses. The condition score of 6 shows some small questions about cash ratios compared to field companies, though the company keeps strong debt safety measures with an Altman-Z score showing no failure risk. Price scores of 5 suggest the stock is not overly priced relative to past and field comparison points.
Investment Points
While the fundamental view looks good in general, investors should notice certain points. The company's dividend payment stays fairly low at 0.67%, and dividend payments have been falling in recent years. Future earnings growth estimates show some slowing compared to past performance, though sales growth outlooks stay positive. These items might worry investors focused on income but matter less for those focusing on value growth through business expansion.
For investors wanting to find other businesses that fit Peter Lynch's investment rules, more filtering results can be found using the Peter Lynch Strategy screener.
Disclaimer: This review is based on fundamental information and past performance. It does not form investment guidance, and investors should do their own study and think about their personal money situation before making investment choices. Past results do not ensure future outcomes.