
In the world of long-term investing, few strategies carry the history of Peter Lynch’s approach, famously outlined in One Up on Wall Street. As the well-known manager of the Magellan Fund, Lynch achieved high returns by focusing on companies with lasting growth, good financial health, and fair valuations, a philosophy often called Growth at a Reasonable Price (GARP). His method avoids speculative stocks in favor of businesses increasing at a steady, clear pace. A key instrument for using this strategy is a stock screener that sorts for specific fundamental measures, trying to find companies that are both profitable and carefully priced for the long term.
One company that recently appeared from such a Peter Lynch-inspired screen is Dr. Reddy's Laboratories Ltd. (NYSE:RDY). As a large global pharmaceutical company based in India, Dr. Reddy’s works in generics, branded generics, active pharmaceutical ingredients (APIs), and biosimilars. But does its financial picture fit the Lynch ideas of lasting growth and good valuation? A look at the key screening measures and the company's wider fundamentals indicates it makes a good case for GARP-focused investors.
Meeting the Lynch Criteria
The Peter Lynch screen uses several strict filters to find companies with the right mix of growth, profit, and financial strength. Dr. Reddy’s Laboratories fits these core needs, which are made to sort out highly speculative or financially poor businesses.
- Lasting Earnings Growth: Lynch liked companies increasing earnings per share (EPS) between 15% and 30% each year over five years, fast enough to be interesting, but slow enough to last. Dr. Reddy’s reports a solid five-year EPS growth rate of 23.6%, well inside this target area. This shows a good past record of growing profit.
- Fair Valuation (PEG Ratio): Maybe the central idea of the Lynch approach is the Price/Earnings to Growth (PEG) ratio, which tries to find stocks that are fairly priced next to their growth rate. A PEG ratio of 1 or less is seen as good. Dr. Reddy’s has a PEG ratio of 0.77, suggesting the market may be pricing its past growth low when seen this way.
- Good Profit (Return on Equity): Lynch searched for companies that effectively make profits from shareholder equity. A minimum Return on Equity (ROE) of 15% shows high-quality profit. Dr. Reddy’s passes this mark with an ROE of 16.0%, showing efficient use of investor money.
- Careful Financial Structure: To make sure of stability, the screen requires a Debt-to-Equity ratio below 0.6, with Lynch himself liking levels under 0.25. Dr. Reddy’s shows a very careful balance sheet with a Debt-to-Equity ratio of only 0.03, meaning very little use of debt financing.
- Financial Health (Current Ratio): Short-term cash is checked by the Current Ratio, needing a value of at least 1. Dr. Reddy’s has a Current Ratio of 1.85, showing enough current assets to pay its short-term bills.
A Wider Fundamental View
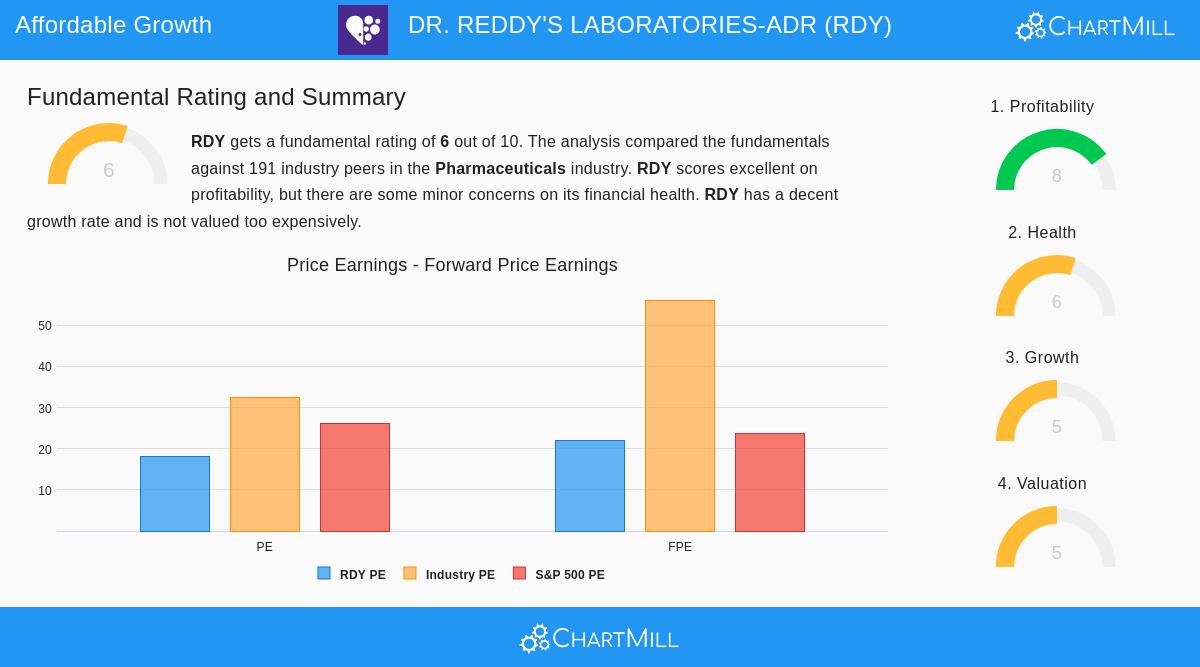
While the screen gives a good first filter, Lynch supported deeper research. A check of Dr. Reddy’s full fundamental analysis report gives a more detailed picture. The company gets an overall fundamental score of 6 out of 10, placing it well inside its competitive pharmaceuticals industry.
The report points out several key good points that fit an investor looking for quality and stability:
- Very Good Profit: The company scores an 8 out of 10 for profit, with high industry ranks for Return on Assets (10.62%), Return on Invested Capital (13.03%), and profit margins. Its operating margin of 19.62% is especially good.
- Strong Solvency: The financial health score of 6 is helped by an excellent Altman-Z score (5.67) and very low debt levels, indicating a low chance of financial trouble.
- Industry-Relative Valuation: Even with a standalone P/E ratio of 18.09 that may seem fair, Dr. Reddy’s is priced lower than most of its industry peers based on P/E, Price/Free Cash Flow, and Enterprise Value/EBITDA ratios.
The analysis also mentions areas for more study, which a careful Lynch-style investor would check. These include a falling dividend trend, a recent drop in cash ratios compared to peers, and analyst views for a small decrease in EPS growth soon. This possible growth slowdown is an important point for the "reasonable price" check, as the good past PEG ratio is based on old, not future, growth.
Investment Idea for the GARP Investor
For an investor using a Peter Lynch or GARP strategy, Dr. Reddy’s Laboratories presents an idea built on proven results and financial care. The company has provided the kind of steady, double-digit earnings growth that Lynch wanted, all while keeping a very strong balance sheet with almost no debt. Its price, especially when growth is considered via the PEG ratio, seems fair, particularly inside the often-highly priced pharmaceuticals sector.
The business itself, creating and making generic and specialty medicines, fits the Lynch model of a "simple" but necessary industry that an investor can know. The global need for low-cost pharmaceuticals gives a long-term support for its main generics and API parts. The test, as always, is lasting ability. The investor’s work now moves to judging whether the company can handle price pressures, good product releases, and pipeline growth to keep a sound growth rate that supports its price over the next ten years.
Finding Like Chances
Dr. Reddy’s Laboratories is one of a few companies that currently pass the careful filters of the Peter Lynch investment strategy. For investors interested in studying other possible choices that fit these measures for lasting growth at a fair price, you can see the full screen here.
Disclaimer: This article is for information only and does not make financial advice, a suggestion, or an offer to buy or sell any securities. Investing has risk, including the possible loss of principal. Readers should do their own full research and think about their personal financial situation before making any investment choices.