
Peter Lynch’s investment approach, detailed in One Up on Wall Street, centers on finding companies with steady growth at fair prices—commonly called the Growth at a Reasonable Price (GARP) method. This approach highlights key financial measures like earnings growth, profitability, and financial stability while steering clear of overpriced stocks or high debt levels. Stocks that fit these standards are seen as solid choices for long-term holdings, as they combine growth opportunities with sensible pricing.
One stock that matches Lynch’s framework is DR. REDDY'S LABORATORIES-ADR (NYSE:RDY). The Indian pharmaceutical firm, recognized for its generic medications, APIs, and biosimilars, displays several traits that make it a strong pick for GARP-focused investors.
Why RDY Meets the Peter Lynch Standards
-
Steady and Manageable Earnings Growth
- Lynch preferred firms with reliable earnings growth between 15% and 30%, as very high rates often don’t last.
- RDY’s 5-year EPS growth of 23.6% fits well within this range, showing balanced progress.
- The company’s revenue has also increased at a 13.3% yearly rate over the same span, highlighting its ability to grow steadily.
-
Fair Pricing Compared to Growth (PEG Ratio)
- A crucial Lynch measure is the PEG ratio (P/E divided by growth), which should ideally be under 1 to signal a fairly priced growth stock.
- RDY’s PEG ratio of 0.75 implies the stock is priced well relative to its past earnings growth.
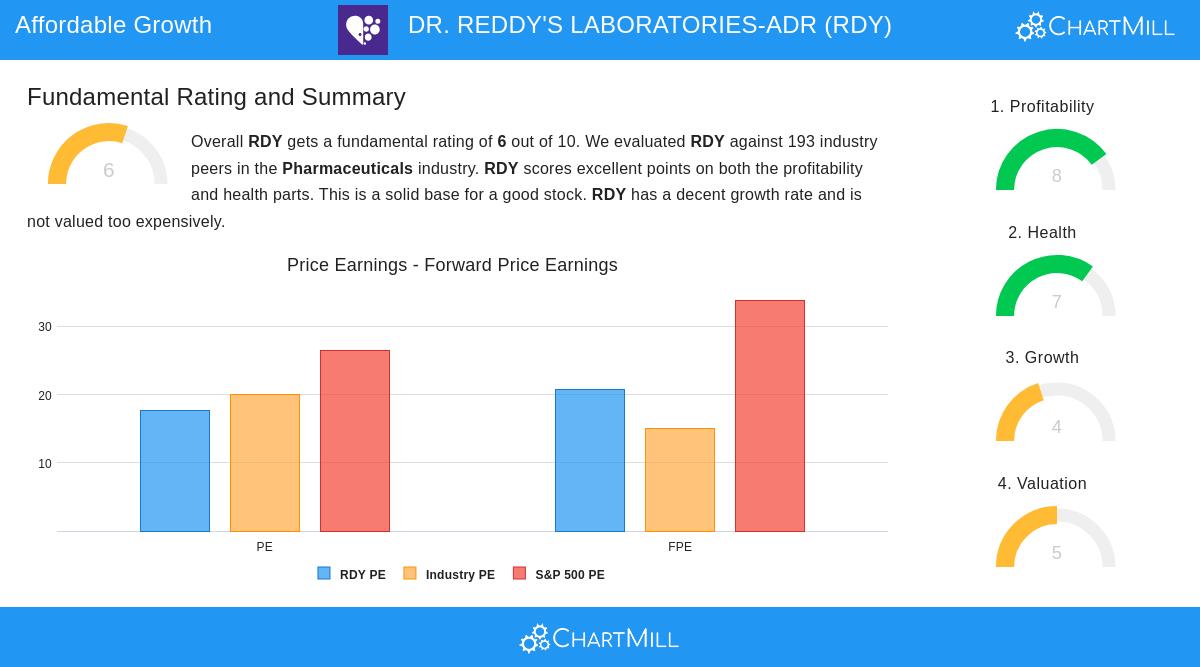
- While its forward P/E of 20.73 seems higher, it remains more affordable than 74.6% of its pharmaceutical peers, according to the fundamental report.
-
High Profitability and Effective Capital Use
- Lynch valued strong return on equity (ROE) as a sign of good management.
- RDY’s ROE of 16.9% beats 90.7% of industry rivals, showing solid profitability.
- Its Return on Invested Capital (ROIC) of 14.6% further confirms smart capital deployment.
-
Low Debt and Stable Finances
- Lynch avoided firms with heavy debt, favoring those with minimal debt-to-equity ratios.
- RDY’s D/E ratio of just 0.02 is far below Lynch’s preferred limit of 0.25, showing little dependence on borrowing.
- The company also holds a strong Altman-Z score of 6.17, indicating very low risk of financial trouble.
-
Adequate Liquidity and Cash Flow
- While RDY’s current ratio of 1.92 is a bit below industry norms, its consistent cash flow (positive FCF for five straight years) eases liquidity worries.
- The debt-to-FCF ratio of 3.89 means it could clear all debts in under four years using free cash flow alone.
Fundamental Report Overview
The full fundamental analysis scores RDY 6 out of 10, with particularly high grades for profitability (8/10) and financial strength (7/10). Key points:
- Excellent margins: Operating margin (21.4%) and profit margin (17.3%) rank among the top in the pharmaceutical industry.
- Slowing but stable growth: While past growth has been solid, future EPS is expected to dip slightly (-2.2% per year), requiring attention.
- Sustainable dividends: The 0.67% yield is modest, but the payout ratio (11.8% of earnings) ensures stability.
Final Thoughts for GARP Investors
RDY’s mix of past growth, fair pricing, and a sturdy balance sheet makes it a clear fit for Lynch-style investors. Though near-term earnings may soften, its established role in generics and biosimilars provides a reliable income foundation.
For those looking for similar options, the Peter Lynch Stock Screener lists other stocks that follow these guidelines.
Disclaimer: This article is not investment advice. Do your own research or consult a financial advisor before making investment decisions.