
Technical Setup: PAYPAL HOLDINGS INC Appears Poised for a Breakout.
By Mill Chart
Last update: Nov 8, 2024
PAYPAL HOLDINGS INC (NASDAQ:PYPL) was identified as a Technical Breakout Setup Pattern by our stockscreener. Such a pattern occurs when we see a pause in a strong uptrend: after a strong rise the stock is consolidating a bit and at some point the trend may be continued. Whether this actually happens can not be predicted of course, but it may be a good idea to keep and eye on NASDAQ:PYPL.
Technical Analysis Observations
ChartMill assigns a Technical Rating to every stock. This score ranges from 0 to 10 and is updated daily. The score is determined by evaluating multiple technical indicators and properties.
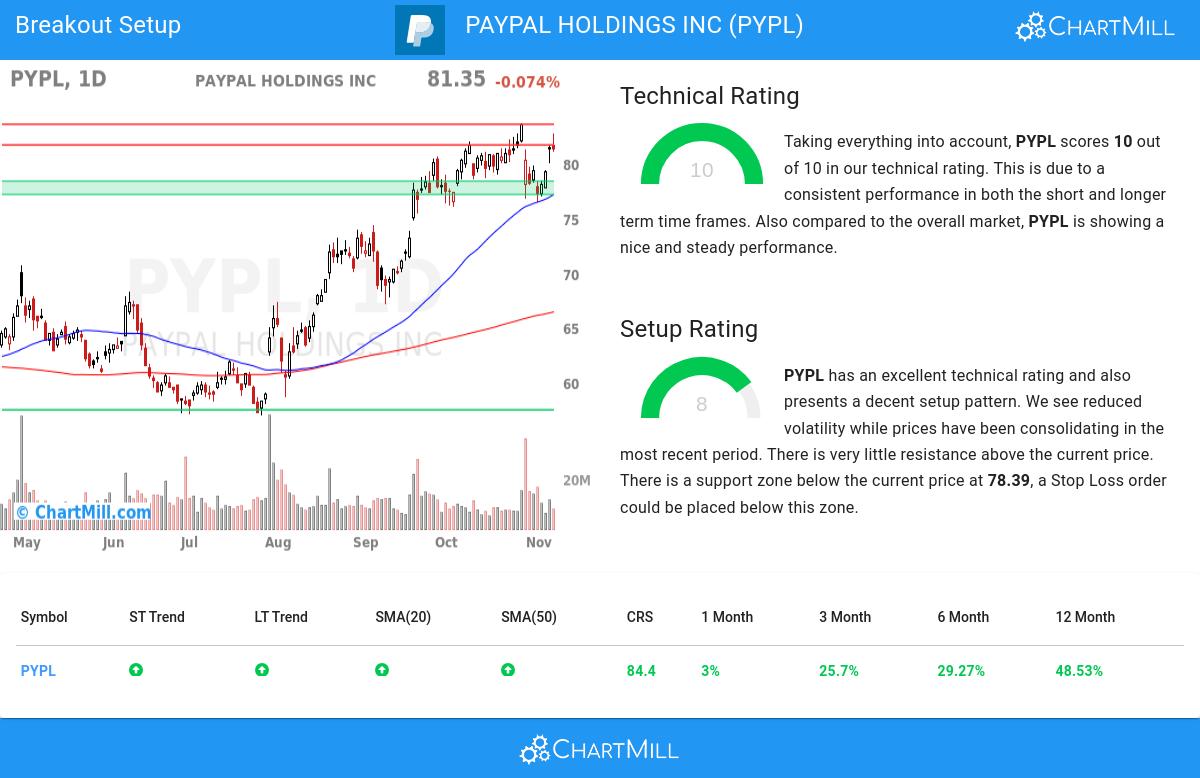
Taking everything into account, PYPL scores 10 out of 10 in our technical rating. This is due to a consistent performance in both the short and longer term time frames. Also compared to the overall market, PYPL is showing a nice and steady performance.
- Both the short term and long term trends are positive. This is a very positive sign.
- Looking at the yearly performance, PYPL did better than 84% of all other stocks. We also observe that the gains produced by PYPL over the past year are nicely spread over this period.
- PYPL is part of the Financial Services industry. There are 100 other stocks in this industry. PYPL outperforms 76% of them.
- PYPL is currently trading near its 52 week high, which is a good sign. The S&P500 Index however is also trading near new highs, which makes the performance in line with the market.
- In the last month PYPL has a been trading in the 76.46 - 83.70 range, which is quite wide. It is currently trading near the high of this range.
Check the latest full technical report of PYPL for a complete technical analysis.
How does the Setup look for NASDAQ:PYPL
Besides the Technical Rating, ChartMill also assign a Setup Rating to every stock. This setup score also ranges from 0 to 10 and determines to which extend the stock is consolidating. This is achieved by evaluating multiple short term technical indicators. NASDAQ:PYPL currently has a 8 as setup rating:
Besides having an excellent technical rating, PYPL also presents a decent setup pattern. Prices have been consolidating lately and the volatility has been reduced. There is very little resistance above the current price. There is a support zone below the current price at 78.39, a Stop Loss order could be placed below this zone.
How to trade NASDAQ:PYPL?
One way to play this would be to wait for the actual breakout to happen and buy when the stock breaks out above the current consolidation zone. A possible place for a stop loss would be below this zone.
Disclaimer: This article is not intended to provide trading advice. It is crucial to conduct your own analysis and consider your own observations and trading style when making investment decisions. The article solely presents technical observations and should not be relied upon as a sole basis for trading.
Every day, new breakout setups can be found on ChartMill in our Breakout screener.
Keep in mind
Important Note: The content of this article is not intended as trading advice. It is essential to perform your own analysis and exercise caution when making trading decisions. The article presents observations created by automated analysis but does not guarantee any trading or investment outcomes. Always trade responsibly and make independent judgments.
61.66
-0.03 (-0.05%)
Find more stocks in the Stock Screener
PYPL Latest News and Analysis

