
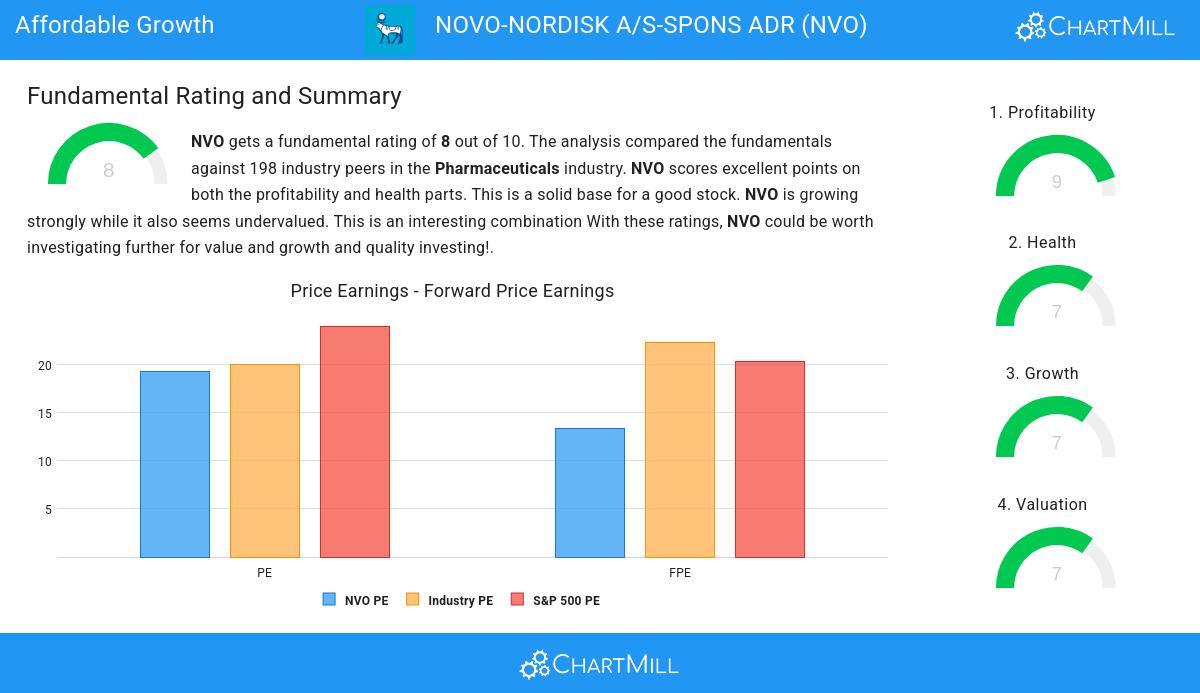
Discover NOVO-NORDISK A/S-SPONS ADR (NYSE:NVO), an undervalued growth gem identified by our stock screener. NVO is shining in terms of growth metrics, and it's also displaying strong financial health and profitability. What's more, it retains an appealing valuation. We'll break it down further.
Assessing Growth for NVO
ChartMill assigns a proprietary Growth Rating to each stock. The score is computed by evaluating various growth aspects, like EPS and revenue growth. We take into account the history as well as the estimated future numbers. NVO was assigned a score of 7 for growth:
- NVO shows a strong growth in Earnings Per Share. In the last year, the EPS has been growing by 15.52%, which is quite good.
- Looking at the last year, NVO shows a very strong growth in Revenue. The Revenue has grown by 25.03%.
- The Revenue has been growing by 18.94% on average over the past years. This is quite good.
- Based on estimates for the next years, NVO will show a quite strong growth in Earnings Per Share. The EPS will grow by 13.97% on average per year.
- Based on estimates for the next years, NVO will show a quite strong growth in Revenue. The Revenue will grow by 12.68% on average per year.
- The EPS growth rate is accelerating: in the next years the growth will be better than in the last years.
Unpacking NVO's Valuation Rating
An integral part of ChartMill's stock analysis is the Valuation Rating, which spans from 0 to 10. This rating evaluates diverse valuation factors, including price to earnings and cash flows, while considering the stock's profitability and growth. NVO has received a 7 out of 10:
- NVO's Price/Earnings ratio is rather cheap when compared to the industry. NVO is cheaper than 82.83% of the companies in the same industry.
- 83.33% of the companies in the same industry are more expensive than NVO, based on the Price/Forward Earnings ratio.
- Compared to an average S&P500 Price/Forward Earnings ratio of 20.35, NVO is valued a bit cheaper.
- Based on the Enterprise Value to EBITDA ratio, NVO is valued cheaply inside the industry as 81.31% of the companies are valued more expensively.
- NVO's Price/Free Cash Flow ratio is rather cheap when compared to the industry. NVO is cheaper than 80.81% of the companies in the same industry.
- The low PEG Ratio(NY), which compensates the Price/Earnings for growth, indicates a rather cheap valuation of the company.
- NVO has an outstanding profitability rating, which may justify a higher PE ratio.
- NVO's earnings are expected to grow with 18.20% in the coming years. This may justify a more expensive valuation.
Health Assessment of NVO
ChartMill employs its own Health Rating for stock assessment. This rating, ranging from 0 to 10, is calculated by examining various liquidity and solvency ratios. In the case of NVO, the assigned 7 reflects its health status:
- An Altman-Z score of 5.52 indicates that NVO is not in any danger for bankruptcy at the moment.
- NVO has a better Altman-Z score (5.52) than 83.33% of its industry peers.
- The Debt to FCF ratio of NVO is 1.48, which is an excellent value as it means it would take NVO, only 1.48 years of fcf income to pay off all of its debts.
- With an excellent Debt to FCF ratio value of 1.48, NVO belongs to the best of the industry, outperforming 93.94% of the companies in the same industry.
- Even though the debt/equity ratio score it not favorable for NVO, it has very limited outstanding debt, so we won't put too much weight on the DE evaluation.
- The current and quick ratio evaluation for NVO is rather negative, while it does have excellent solvency and profitability. These ratios do not necessarly indicate liquidity issues and need to be evaluated against the specifics of the business.
Assessing Profitability for NVO
ChartMill's Profitability Rating offers a unique perspective on stock analysis, providing scores from 0 to 10. These ratings consider a wide range of profitability metrics and margins, both in comparison to industry peers and on their own merits. For NVO, the assigned 9 is a significant indicator of profitability:
- The Return On Assets of NVO (21.68%) is better than 98.48% of its industry peers.
- NVO has a Return On Equity of 70.38%. This is amongst the best in the industry. NVO outperforms 98.48% of its industry peers.
- The Return On Invested Capital of NVO (43.02%) is better than 97.98% of its industry peers.
- Measured over the past 3 years, the Average Return On Invested Capital for NVO is significantly above the industry average of 41.61%.
- The 3 year average ROIC (50.29%) for NVO is well above the current ROIC(43.02%). The reason for the recent decline needs to be investigated.
- The Profit Margin of NVO (34.78%) is better than 96.97% of its industry peers.
- NVO's Profit Margin has improved in the last couple of years.
- NVO has a better Operating Margin (46.16%) than 97.47% of its industry peers.
- NVO's Operating Margin has improved in the last couple of years.
- Looking at the Gross Margin, with a value of 84.67%, NVO belongs to the top of the industry, outperforming 88.89% of the companies in the same industry.
More Affordable Growth stocks can be found in our Affordable Growth screener.
Check the latest full fundamental report of NVO for a complete fundamental analysis.
Keep in mind
This article should in no way be interpreted as advice. The article is based on the observed metrics at the time of writing, but you should always make your own analysis and trade or invest at your own responsibility.

