Checking if KINGSTONE COS INC (NASDAQ:KINS) meets Minervini’s stock selection rules
By Mill Chart
Last update: May 3, 2025
Growth investors are looking for stocks showing high revenue and EPS growth. We will have a look here to see if KINGSTONE COS INC (NASDAQ:KINS) is suited for growth investing. Investors should of course do their own research, but we spotted KINGSTONE COS INC showing up in our Minervini growth screen, so it may be worth spending some more time on it.
A Technical Analysis using the Minervini Trend Template.
The Minervini Trend Template is a set of technical criteria designed to identify stocks in strong uptrends. We can check all the boxes for KINS:
- ✔ Relative Strength is above 70.
- ✔ Current price is within 25% of it's 52-week high.
- ✔ Current price is at least 30% above it's 52-week low.
- ✔ The current price is above the 50-, 150- and 200-day SMA price line.
- ✔ The SMA(200) is trending upwards.
- ✔ The SMA(150) is above the SMA(200)
- ✔ The SMA(50) is above the SMA(150) and the SMA(200)
High Growth Analysis for KINS
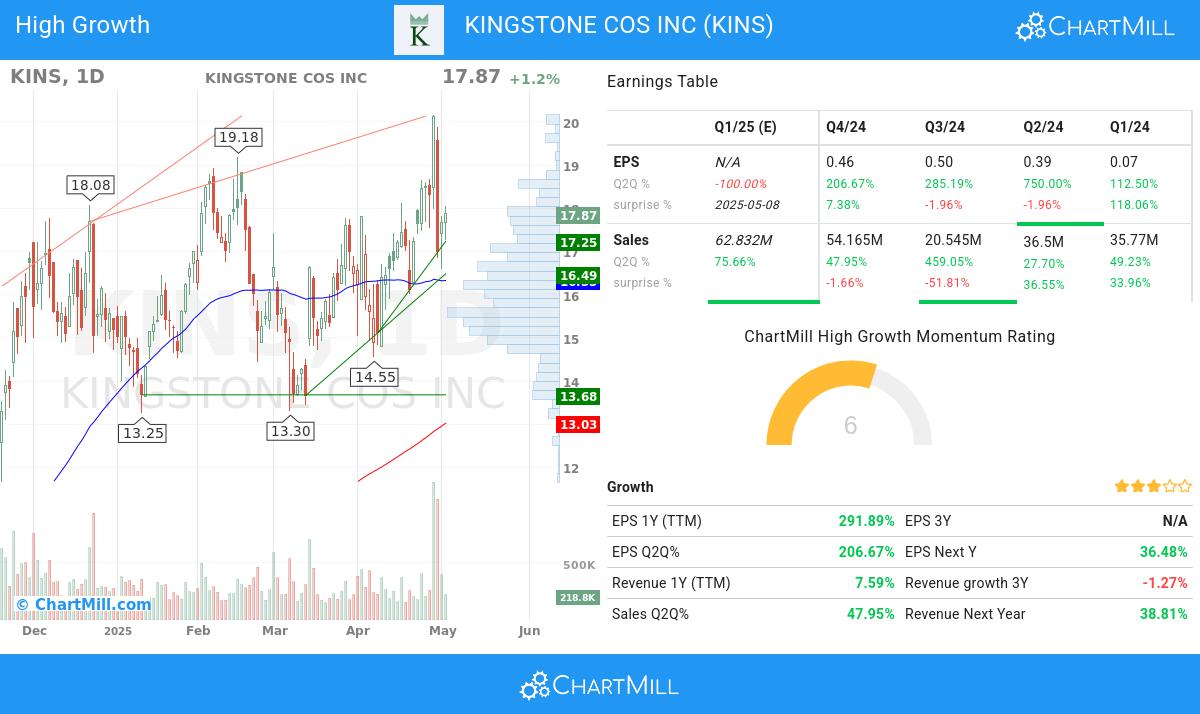
ChartMill assigns a High Growth Momentum Rating (HGM) to each stock, ranging from 0 to 10. This rating is determined by analyzing different growth and profitability elements, including EPS and revenue growth, accelleration, surprises and revisions. In the case of KINS, the assigned 6 reflects its growth potential:
Earnings Momentum
- With a favorable trend in its quarter-to-quarter (Q2Q) earnings per share (EPS), KINS highlights its ability to generate increasing profitability, showcasing a 207.0% growth.
- Over the past year, KINS has demonstrated 292.0% growth in EPS, signifying its positive financial trajectory and potential for future profitability.
- KINS has achieved significant quarter-to-quarter (Q2Q) revenue growth of 47.95%, signaling its ability to capture market opportunities and drive top-line expansion. This growth underscores the company's effective execution and its potential for continued success.
- KINS shows accelerating Sales growth: when comparing the current Q2Q growth of 47.95% to the previous quarter Q2Q growth of 19.09%, we see the growth rate improving.
- Sales growth accelerated for 3 quarters in a row.
Profitability & Financial Strength
- With positive growth in its operating margin over the past year, KINS showcases its ability to improve profitability through effective cost control and operational efficiency. This growth underscores the company's commitment to enhancing its financial performance.
- KINS has experienced notable growth in its free cash flow (FCF) over the past year, signaling improved cash generation and strong financial performance. This growth suggests the company's ability to generate excess cash for reinvestment or shareholder returns.
- KINS exhibits a strong Return on Equity (ROE) of 27.52%, indicating the company's ability to generate solid returns on shareholder investments. This metric reflects the company's efficient utilization of equity capital and its profitability.
- With a Debt/Equity ratio of 0.17, KINS appears to have a manageable debt load relative to its assets.
Market Strength
- The Relative Strength (RS) of KINS has been consistently solid, with a current 99.21 rating. This highlights the stock's ability to exhibit sustained price strength and signifies its competitive advantage.
Looking at the Setup
ChartMill assigns a Setup Rating to every stock to determine the degree of consolidation. This rating, ranging from 0 to 10, is updated daily and evaluates various short-term technical indicators. KINS currently holds a 4 as its setup rating, suggesting a particular level of consolidation in the stock.
KINS has an excellent technical rating, but the quality of the setup is only medium at the moment. Price movement has been a little bit too volatile to find a nice entry and exit point. It is probably a good idea to wait for a consolidation first.
Our latest full technical report of KINS contains the most current technical analsysis.
More like this
More ideas for high growth momentum stocks can be found on ChartMill in our High Growth Momentum + Trend Template screen.
Keep in mind
This article should in no way be interpreted as advice. The article is based on the observed metrics at the time of writing, but you should always make your own analysis and trade or invest at your own responsibility.
21.67
+3.48 (+19.13%)
Find more stocks in the Stock Screener
KINS Latest News and Analysis
 7 days ago - ChartmillChecking if KINGSTONE COS INC (NASDAQ:KINS) meets Minervini’s stock selection rules
A fundamental and technical analysis of (NASDAQ:KINS): Why KINGSTONE COS INC (NASDAQ:KINS) qualifies as a high growth stock.
