
Peter Lynch’s investment strategy, described in One Up on Wall Street, centers on finding companies with steady growth at fair prices, commonly known as the Growth at a Reasonable Price (GARP) method. The approach relies on fundamental analysis, selecting firms with solid profits, controlled debt, and reliable earnings growth, while steering clear of overpriced or highly indebted businesses. Important measures include a PEG ratio under 1, a debt-to-equity ratio below 0.6, a current ratio over 1, and a return on equity (ROE) above 15%. These factors guide investors toward businesses that combine growth opportunities with financial soundness, matching Lynch’s emphasis on holding investments for the long term.
JD.COM INC-ADR (NASDAQ:JD) appears to fit this model. The Chinese e-commerce leader, active in retail, logistics, and delivery services, displays many traits Lynch looked for in growth stocks.
Why JD.com Matches the Peter Lynch Standards
-
Steady Earnings Growth at a Manageable Rate
- Lynch favored firms with earnings per share (EPS) growth between 15% and 30%, fast enough to show progress but not so quick as to be unstable. JD.com’s 5-year EPS growth of 26.75% fits this range.
- Expected EPS growth is 25.10%, indicating ongoing progress without excessive risk.
-
Fair Pricing Through the PEG Ratio
- A key part of Lynch’s method is the PEG ratio (P/E divided by earnings growth), which should be ≤1 to show the stock is priced fairly relative to growth. JD’s PEG ratio of 0.24, well below the target, suggests the stock is undervalued given its growth path.
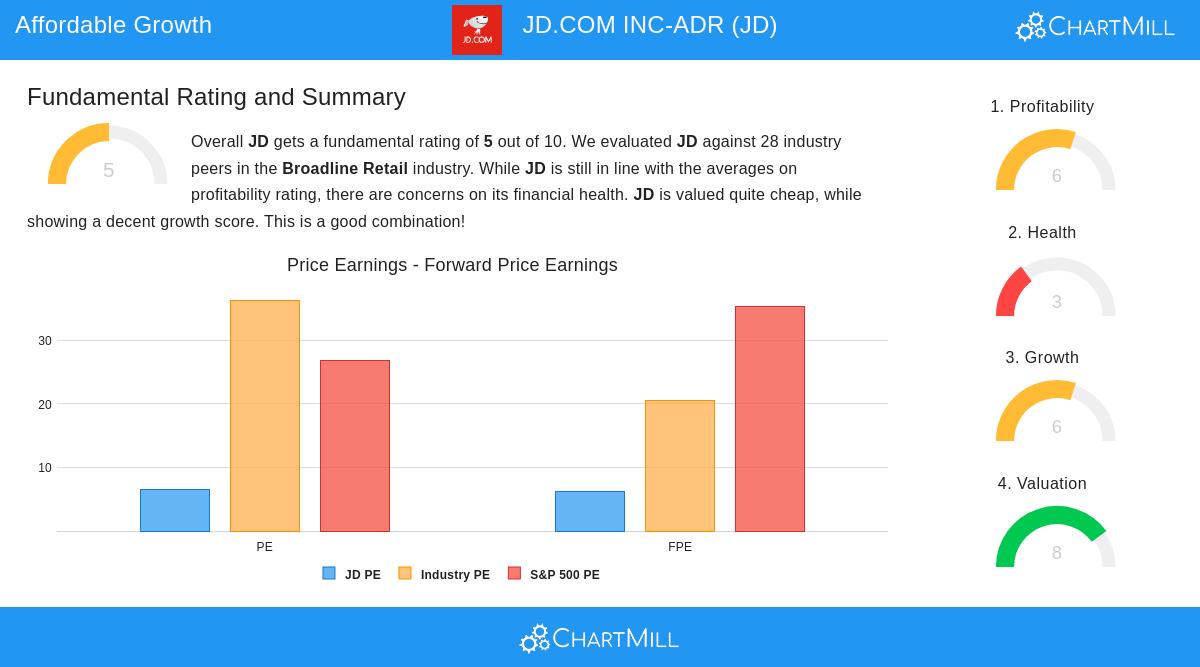
- The company’s P/E ratio of 6.47 is also much lower than the industry average (36.30) and the S&P 500 (26.82), supporting its appeal as a value pick.
-
Solid Financial Position with Balanced Debt
- Lynch preferred businesses with minimal debt, ideally a debt-to-equity ratio under 0.25. JD’s ratio of 0.25 meets this strict standard, showing a cautious approach to borrowing.
- The current ratio of 1.22 is above Lynch’s minimum of 1, meaning the company can handle short-term liabilities.
-
Strong Performance Indicators
- ROE, which shows how well a company uses shareholder equity to generate profits, is 17.02%, exceeding Lynch’s 15% target. This points to capable leadership and a strong position in its field.
- While JD’s gross margins are modest (16.02%), its operating and net margins have grown, fitting Lynch’s interest in operational effectiveness.
Key Strengths and Points to Watch
JD.com’s fundamental analysis report reveals a balanced yet encouraging outlook:
- Performance: The company performs well on ROE and profit margins, though its return on invested capital (ROIC) trails some competitors.
- Pricing: JD is attractively priced based on several metrics, including P/E, forward P/E, and enterprise value-to-EBITDA.
- Expansion: Revenue and EPS growth remain solid, though sales growth is expected to slow.
- Stability: While debt is low, liquidity ratios (current and quick ratios) are below industry norms, requiring attention.
Final Thoughts
For investors looking for growth at a fair price, JD.com offers a strong option. Its mix of reliable earnings growth, reasonable pricing, and careful debt management aligns with Peter Lynch’s ideas. Though challenges like margin pressures and liquidity exist, the stock’s fundamentals indicate long-term promise for those willing to wait.
To find more stocks that meet the Peter Lynch criteria, check the full screen results here.
Disclaimer: This article is not investment advice. Do your own research or consult a financial advisor before making investment decisions.