Interesting Technical Analysis finding for GILEAD SCIENCES INC (NASDAQ:GILD)
By Mill Chart
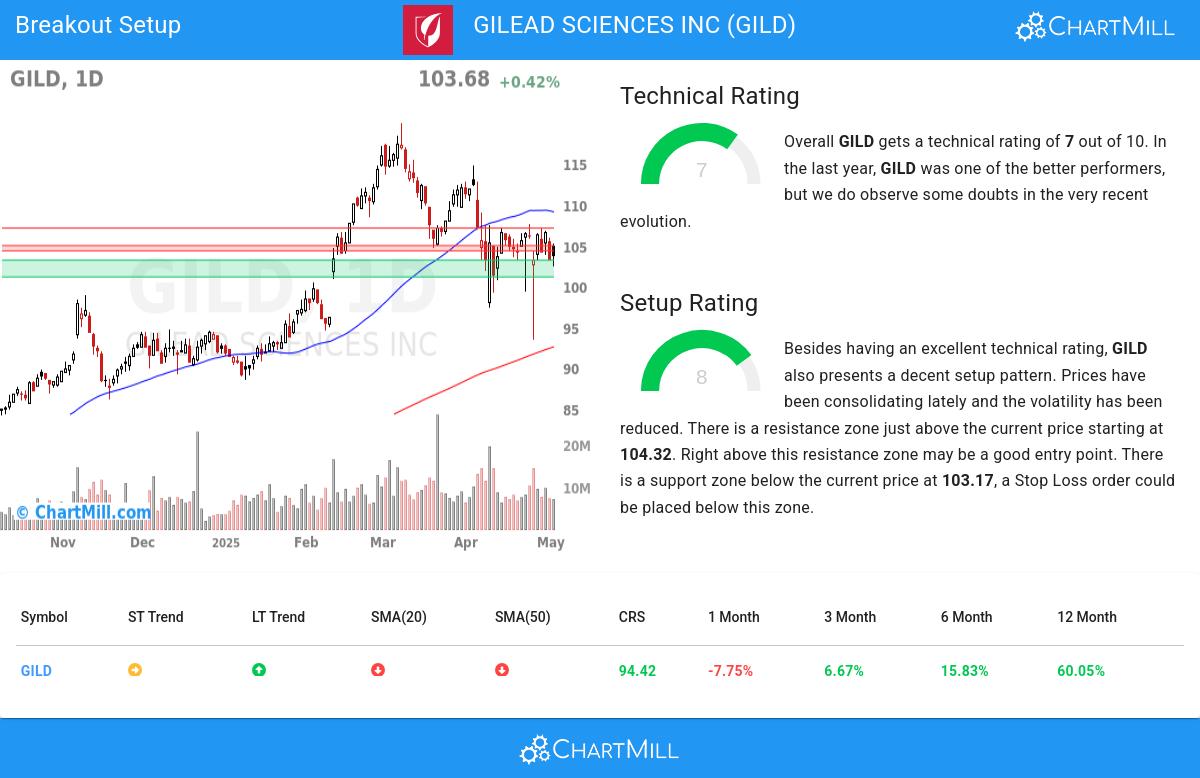
Last update: May 3, 2025
A possible breakout setup was detected on GILEAD SCIENCES INC (NASDAQ:GILD) by our stockscreener. A breakout pattern is formed when a stock consolidates after a strong rise up. We note that this pattern is detected purely based on technical analysis and whether the breakout actually materializes remains to be seen. It could be interesting to keep an eye on NASDAQ:GILD.
What is the technical picture of GILD telling us.
ChartMill utilizes a proprietary algorithm to assign a Technical Rating to every stock. This rating, ranging from 0 to 10, is computed daily by analyzing a variety of technical indicators and properties.
Overall GILD gets a technical rating of 7 out of 10. In the last year, GILD was one of the better performers, but we do observe some doubts in the very recent evolution.
- The short term is neutral, but the long term trend is still positive. Not much to worry about for now.
- When comparing the yearly performance of all stocks, we notice that GILD is one of the better performing stocks in the market, outperforming 94% of all stocks. On top of that, GILD also shows a nice and consistent pattern of rising prices.
- GILD is part of the Biotechnology industry. There are 566 other stocks in this industry. GILD outperforms 92% of them.
- GILD is currently trading in the upper part of its 52 week range. The market is still in the middle of its 52 week range, so GILD slightly outperforms the market at the moment.
- In the last month GILD has a been trading in the 93.37 - 112.87 range, which is quite wide. It is currently trading in the middle of this range where prices have been consolidating recently, this may present a good entry opportunity, but some resistance may be present above.
For an up to date full technical analysis you can check the technical report of GILD
How does the Setup look for GILD
ChartMill also assign a Setup Rating to every stock. With this score it is determined to what extend the stock has been trading in a range in the recent days and weeks. This score also ranges from 0 to 10 and is updated daily. The setup score evaluates various short term technical indicators. GILD scores a 8 out of 10:
GILD has an excellent technical rating and also presents a decent setup pattern. We see reduced volatility while prices have been consolidating in the most recent period. There is a resistance zone just above the current price starting at 104.32. Right above this resistance zone may be a good entry point. There is a support zone below the current price at 103.17, a Stop Loss order could be placed below this zone.
How to trade GILD?
To potentially initiate a trade, it is common practice to wait for the stock to break out of the consolidation zone. This breakout signifies a potential upward movement, and traders may enter the stock at that point. Conversely, if the stock falls back below the consolidation zone, it may be sold at a loss.
Disclaimer: This article is not intended to provide trading advice. It is crucial to conduct your own analysis and consider your own observations and trading style when making investment decisions. The article solely presents technical observations and should not be relied upon as a sole basis for trading.
More breakout setups can be found in our Breakout screener.
Keep in mind
This is not investing advice! The article highlights some of the observations at the time of writing, but you should always make your own analysis and invest based on your own insights.
103.68
+0.43 (+0.42%)
Find more stocks in the Stock Screener
GILD Latest News and Analysis
 2 days ago - ChartmillInteresting Technical Analysis finding for GILEAD SCIENCES INC (NASDAQ:GILD)
Exploring GILEAD SCIENCES INC's Technical Signals and Breakout Potential: Based on good technical signals, GILEAD SCIENCES INC is potentially setting up for a breakout.
 7 days ago - ChartmillThese S&P500 stocks are moving in today's session
Curious about the S&P500 stocks that are in motion on Monday? Join us as we explore the top movers within the S&P500 index during today's session.
7 days ago - ChartmillExploring the top movers within the S&P500 index during today's session.Join us in exploring the top gainers and losers within the S&P500 index in the middle of the day on Monday as we examine the latest happenings in today's session.
 10 days ago - ChartmillGet insights into the top movers in the S&P500 index of Friday's pre-market session.
Stay updated with the S&P500 stocks that are on the move in today's pre-market session.
 11 days ago - ChartmillWhich S&P500 stocks are moving after the closing bell on Thursday?
The regular session of the US market on Thursday is now over, but let's get a preview of the after-hours session and explore the top S&P500 gainers and losers driving the post-market movements.
 16 days ago - ChartmillWhy Quality Investors May Find GILEAD SCIENCES INC (NASDAQ:GILD) Attractive.
A fundamental analysis of (NASDAQ:GILD) shows GILEAD SCIENCES INC (NASDAQ:GILD) may be suited for quality investing, we'll explore why in this article.
