
Technical investors often look for stocks showing both good momentum and consolidation patterns that indicate possible breakout chances. The ChartMill Technical Breakout system assesses securities with two specific scores: the Technical Rating, which gauges general technical condition and trend quality, and the Setup Quality Rating, which finds consolidation patterns providing good entry and exit spots. Stocks with high marks in both areas usually show interesting chances for breakout trading approaches.
Technical Strength Assessment
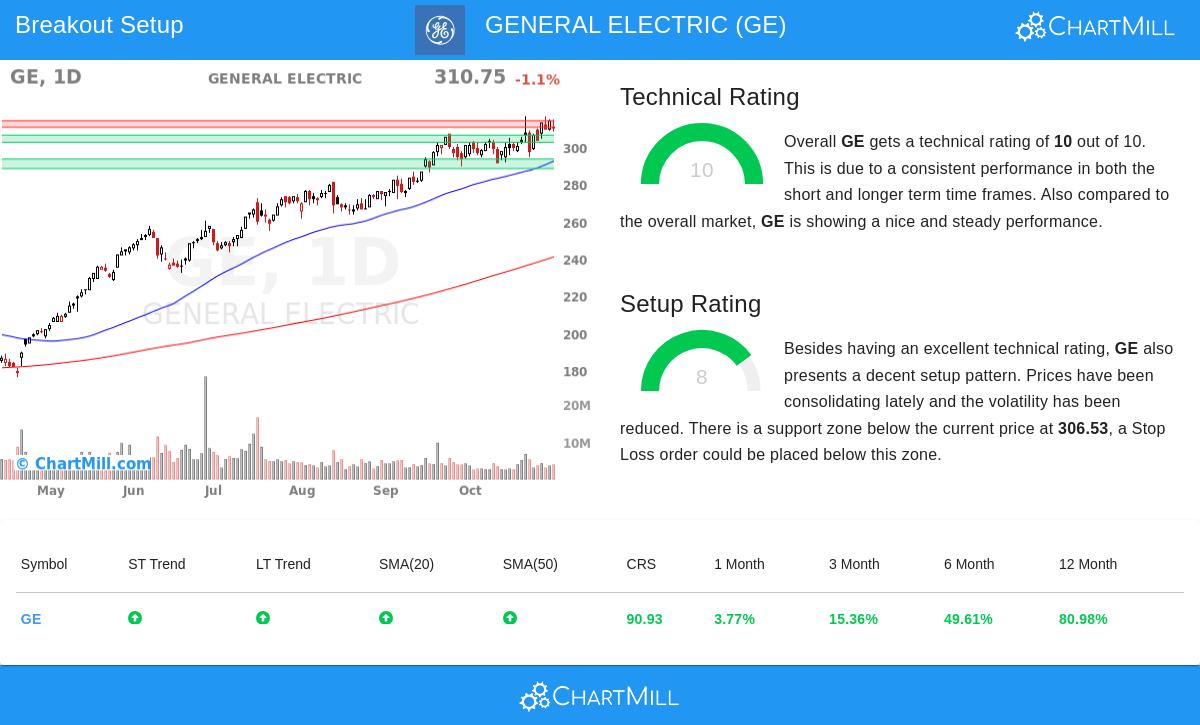
General Electric (NYSE:GE) shows very good technical features, receiving a top Technical Rating of 10. This highest rating shows solid performance across different time periods and technical measures. The company's technical condition comes from several main points:
- Both long-term and short-term trends stay positive, showing continued buying interest
- The stock performs better than 90% of all stocks over the last year, with increases spread evenly during this time
- Price stays above all main moving averages (20, 50, 100, and 200-day SMAs), with each average moving up
- Relative strength measures 90.93, putting GE with market front-runners
- Current trading near 52-week highs points to ongoing strength, though this matches wider market activity
This technical quality places GE as a notable stock in the Aerospace & Defense industry, where it does better than 72% of similar companies. The mix of good trend features, better relative performance, and maintained momentum makes GE especially interesting for trend-based methods. Investors looking for technically good stocks value these features because they point to lower downside chance and higher possibility of continued upward price movement.
Setup Quality Analysis
Besides technical condition, GE shows an interesting setup pattern with a Setup Quality Rating of 8. This rating means the stock has been moving in a set range while keeping its basic strength. The setup review shows several positive features:
- Recent trading has happened within the $291.49 to $316.67 range, showing consolidation after earlier gains
- Several support areas exist below the current price, with the closest support from $302.66 to $306.53
- A defined resistance area between $310.76 and $314.29 gives a possible breakout level
- Lower volatility during consolidation indicates balance between buyers and sellers
The existence of clear support and resistance levels makes an organized trading situation. For breakout traders, these consolidation patterns after good upward moves often come before the next price increase. The setup allows for exact risk control, with logical stop-loss spots below support areas and clear breakout levels above resistance.
Trading Considerations
The technical review indicates a possible trading setup with entry above $314.30, meaning a breakout above the present resistance area. A stop-loss below $302.65 would limit risk to about 3.71% of the trade value. The Average True Range of 8.21 points shows normal daily price movement, though traders should note the somewhat close stop-loss distance compared to this volatility measure.
Four separate support areas give several layers of possible price stability:
- Main support between $302.66 and $306.53
- Next support from $288.51 to $293.63
- More support levels at $265.92-$266.52 and $174.62
These support levels allow for choice in position size and risk control methods based on personal risk comfort and time frame.
Market Context and Volume
Trading volume stays good with a 50-day average of about 4 million shares, giving enough liquidity for position entry and exit. The stock's activity matches the wider market, as both GE and the S&P 500 trade close to their individual highs. This relationship suggests the stock's strength shows overall market conditions instead of separate company-specific reasons.
For investors looking for similar technical breakout chances, the Technical Breakout Setups screen gives daily updated results finding stocks with good technical ratings and high-quality setup patterns. This methodical process helps find possible breakout candidates across the market.
Disclaimer: This review is based on technical measures and historical price patterns and should not be taken as investment advice. Trading carries significant risk, and past performance does not ensure future outcomes. Always do your own research and think about your risk comfort before making investment choices. The described trade setup is automatically created and for example only.