
For investors looking for chances where the market price may not completely show a company's basic strength, a disciplined screening process can be a useful instrument. One such method is to look for stocks that seem basically priced low while still showing solid operational health and earnings. This approach matches core value investing ideas, which concentrate on finding companies trading below their real worth, but with the important warning of steering clear of "value traps"—companies that are inexpensive for a cause. By selecting for stocks with good valuation ratings along with acceptable scores in growth, financial condition, and earnings, investors try to find businesses that are not only priced well but are also basically healthy and able to produce future gains.
A recent filter using this "acceptable value" plan has pointed to Expedia Group Inc (NASDAQ:EXPE) as a possible choice. As a top online travel company running brands like Expedia.com, Hotels.com, and Vrbo, Expedia is positioned where travel demand and digital commerce meet. The company's basic profile, as shown in its detailed ChartMill report, shows a combination of strong valuation measures and solid operational performance that calls for more examination from value-focused investors.
Valuation: A Clear Case for Low Pricing
The foundation of any value investment idea is a good price compared to the company's earnings and cash flow. Expedia's valuation measures are notable as especially strong, both in its industry and compared to the wider market.
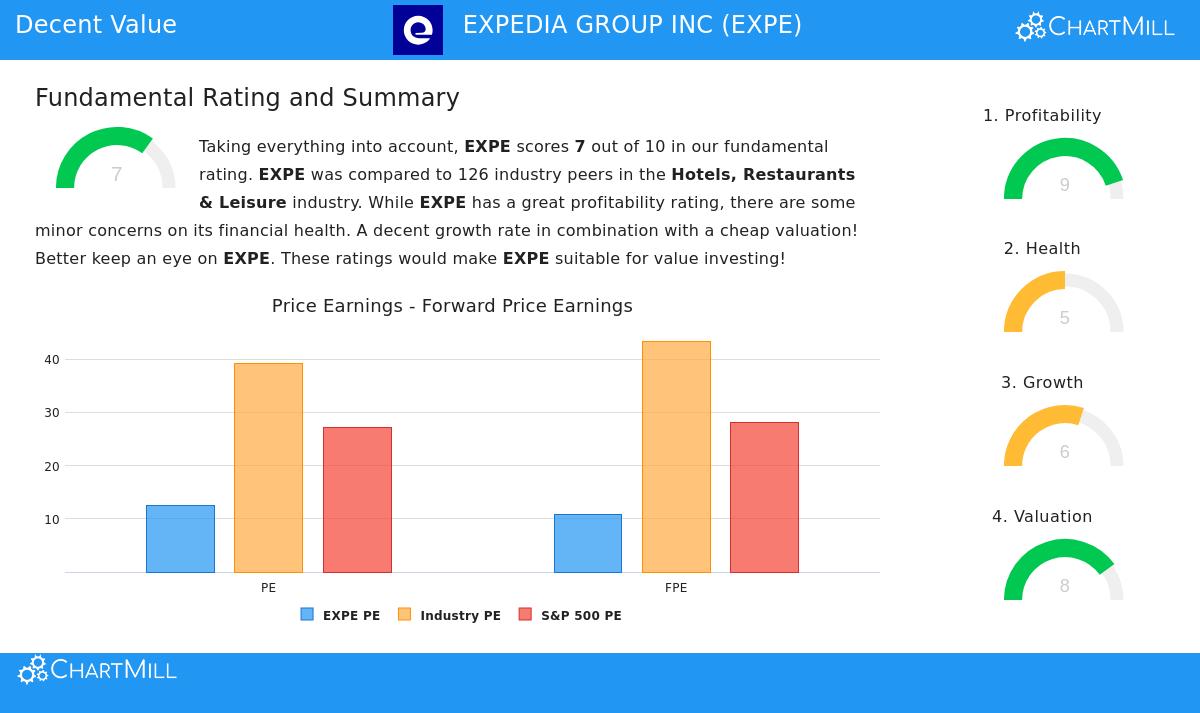
- Price-to-Earnings (P/E) Ratio: At 12.53, Expedia's P/E ratio is much lower than the S&P 500 average of 27.16. More significantly, it is less expensive than about 82% of similar companies in the Hotels, Restaurants & Leisure industry, where the average P/E is above 39.
- Forward P/E Ratio: The view stays good looking forward. With a forward P/E of 10.82, based on expected earnings, Expedia is valued more cheaply than about 86% of its industry rivals and remains a small part of the S&P 500's forward P/E of 28.10.
- Price-to-Free Cash Flow: This is a key measure for value investors, as it shows how much cash flow a business produces relative to its market price. Expedia does very well here, with a valuation that is less expensive than 94% of its industry based on this measure.
This set of valuation information indicates the market is pricing Expedia cautiously. For a value investor, these ratios give a number-based foundation for the view that the stock's current price may not fully account for the company's earning ability, creating a possible buffer.
Profitability: Showing Operational Strength
A low-priced stock is only a good investment if the company is earning money and efficiently uses capital. An inexpensive stock from a money-losing business is often a value trap. Expedia's earnings profile is, actually, a main positive, giving it a high score of 9 out of 10.
- The company has notable returns on capital, with a Return on Invested Capital (ROIC) of 22.36%, doing better than almost 93% of its industry. Its three-year average ROIC of 16.54% is also well above the industry average.
- Margins are strong and increasing. Expedia's Gross Margin of over 90% is very good, putting it in the top group of its sector. Both its Operating Margin (14.68%) and Profit Margin (8.78%) have shown good growth in recent years and compare well to industry peers.
This high level of earnings is key for the value idea. It shows that Expedia is not just a cheap stock, but a good-quality business creating large returns on the capital it uses. This operational strength backs the argument that the company's real value is solid.
Financial Condition & Growth: A Balanced View
While the valuation and earnings scores are clear positives, a complete view needs looking at financial condition and growth outlook. Expedia shows a more detailed picture here, with some areas of strength and others that need watching.
Financial Condition (Score: 5/10): The company's solvency shows a mixed result. On the good side, its Debt-to-Free Cash Flow ratio is very good at 1.98, meaning it could in theory pay off all its debt with less than two years of cash flow. This is a top-level measure within its industry. However, this positive is balanced by a high Debt-to-Equity ratio and low liquidity ratios (Current and Quick Ratios below 1), which show possible short-term payment pressure. The Altman-Z score also indicates some financial risk. For a value investor, this highlights the importance of the "buffer" given by the low valuation, as it protects against these noted financial risks.
Growth (Score: 6/10): Expedia's growth story is one of a strong past moving to more average future expectations. The company has provided very good historical growth in both Earnings Per Share (average 33% yearly) and Revenue (average 23% yearly). Looking ahead, analysts expect EPS growth to continue at a reasonable 13-15% yearly, though revenue growth is estimated to slow to a more modest mid-single-digit rate. This slowing is a key point to watch but is likely already accounted for in the stock's low valuation multiples.
Conclusion: A Value Case in Travel
Expedia Group presents a strong case for investors filtering for low-priced stocks with healthy basics. The center of the idea depends on its notably inexpensive valuation compared to its peer group and the market, paired with an excellent history of earnings and high returns on capital. These are exactly the number-based supports value investors look for.
The points about its balance sheet debt and slowing growth path are fair and show why a filter that looks past just valuation is important. They represent the known risks that the good valuation is meant to make up for. The total basic score of 7/10 suggests a stock with clear positives and some negatives, trading at a price that may not fully consider its earning ability and market place.
For investors wanting to examine other companies that fit similar standards of good valuation along with acceptable basics, more study can be done using the Acceptable Value Stocks filter on ChartMill.
Disclaimer: This article is for information only and does not make up financial guidance, a suggestion, or an offer or request to buy or sell any securities. The content shown is based on data thought to be reliable but is not assured. Investors should do their own separate research and talk with a qualified financial consultant before making any investment choices. Past results are not a sign of future outcomes.