Based on good technical signals, EXELON CORP (NASDAQ:EXC) is potentially setting up for a breakout.
By Mill Chart
Last update: May 3, 2025
We've identified EXELON CORP (NASDAQ:EXC) as a potential breakout candidate based on our stock screener's analysis. This breakout setup pattern suggests that after a strong uptrend, the stock is currently consolidating, potentially signaling a continuation of the trend. Keep an eye on NASDAQ:EXC for further developments.
Technical Analysis Observations
Every day, ChartMill assigns a Technical Rating to each stock, providing a score ranging from 0 to 10. This rating is determined by evaluating various technical indicators and properties.
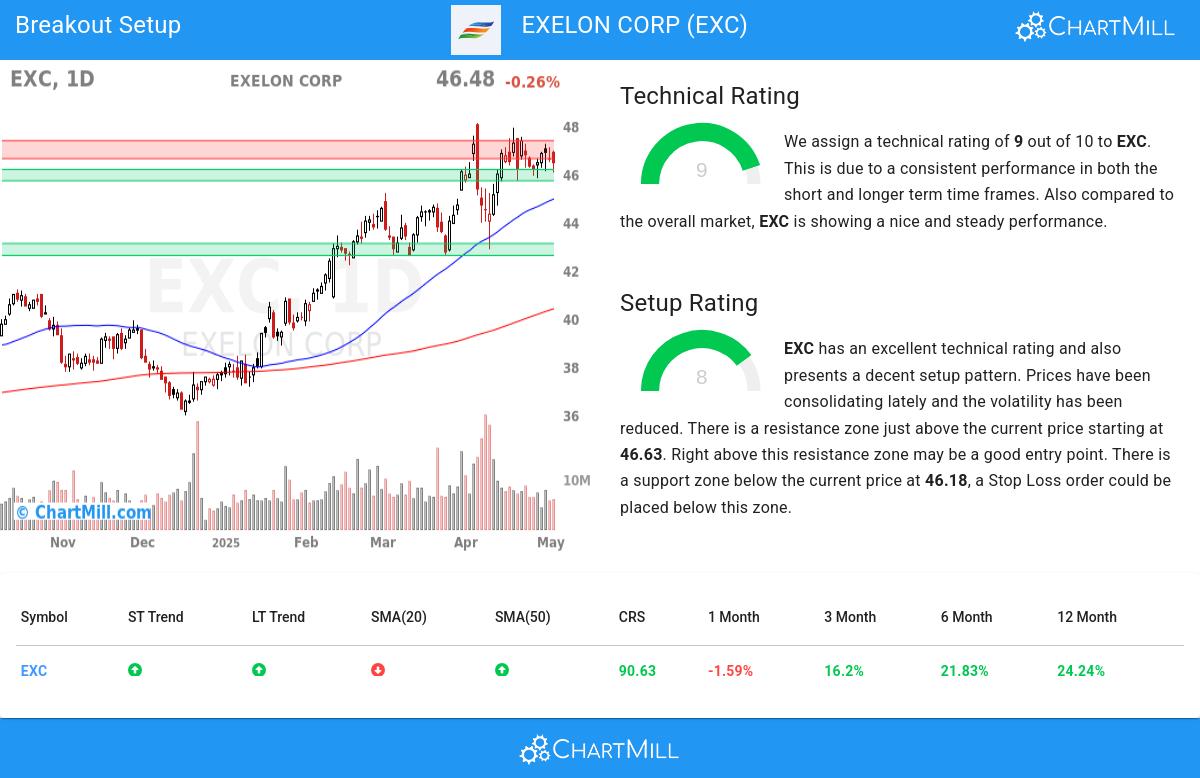
Taking everything into account, EXC scores 9 out of 10 in our technical rating. This is due to a consistent performance in both the short and longer term time frames. Also compared to the overall market, EXC is showing a nice and steady performance.
- The long and short term trends are both positive. This is looking good!
- Looking at the yearly performance, EXC did better than 90% of all other stocks.
- EXC is one of the better performing stocks in the Electric Utilities industry, it outperforms 93% of 46 stocks in the same industry.
- EXC is currently trading in the upper part of its 52 week range. The market is still in the middle of its 52 week range, so EXC slightly outperforms the market at the moment.
- EXC is currently showing a bull flag pattern! A bull flag pattern occurs when prices pull back slightly after a strong rise up. This may be a nice opportunity for an entry.
Our latest full technical report of EXC contains the most current technical analsysis.
Looking at the Setup
In addition to the Technical Rating, ChartMill provides a Setup Rating for each stock. This rating, ranging from 0 to 10, assesses the extent of consolidation in the stock based on multiple short-term technical indicators. Currently, EXC has a 8 as its setup rating:
Besides having an excellent technical rating, EXC also presents a decent setup pattern. Prices have been consolidating lately and the volatility has been reduced. There is a resistance zone just above the current price starting at 46.63. Right above this resistance zone may be a good entry point. There is a support zone below the current price at 46.18, a Stop Loss order could be placed below this zone.
How to trade EXC?
A breakout could materialize when the stock breaks out to new highs above the current consolidation zone. One could wait for this to happen and buy when this happens. A stop loss could be placed below the consolidation zone.
Of course, there are many ways to trade or not trade EXC and this article should in no way be interpreted as trading advice. The article is purely based on an automated technical analysis and just points out the technical observations. Always make your own analysis and trade at your own responsibility.
Our Breakout screener lists more breakout setups and is updated daily.
Disclaimer
This article should in no way be interpreted as advice. The article is based on the observed metrics at the time of writing, but you should always make your own analysis and trade or invest at your own responsibility.
46.29
+0.29 (+0.63%)
Find more stocks in the Stock Screener
EXC Latest News and Analysis
 4 days ago - ChartmillBased on good technical signals, EXELON CORP (NASDAQ:EXC) is potentially setting up for a breakout.
Exploring EXELON CORP's Technical Signals and Breakout Potential: Promising Signs: EXELON CORP Setting the Stage for a Breakout.
