
Dorman Products Inc (NASDAQ:DORM) has become a noteworthy option for investors using the Peter Lynch investment methodology, which focuses on finding companies with maintainable growth paths trading at acceptable prices. This method, explained in Lynch's book One Up on Wall Street, stresses fundamental analysis and long-term holding periods, looking for businesses that show steady earnings growth, sound finances, and profitability without high speculation. The strategy intentionally does not pursue very high-growth companies, instead favoring those increasing at steady rates that can be continued over many years.
Investment Criteria Alignment
Dorman Products meets several important screens from the Peter Lynch methodology, placing it as a possible GARP (Growth at Reasonable Price) investment:
-
Maintainable Earnings Growth: The company has reached a 5-year EPS growth rate of 21.83%, fitting within Lynch's chosen range of 15-30%. This shows steady increase without the unstable rapid growth that often results in letdown.
-
Acceptable Valuation: With a PEG ratio of 0.87 (under Lynch's limit of 1.0), Dorman seems fairly priced compared to its growth path. The PEG ratio adjusts the standard P/E ratio for growth, making it a central part of Lynch's valuation method.
-
Sound Financial Health: The company keeps a debt-to-equity ratio of 0.31, much lower than Lynch's maximum limit of 0.6 and even under his stricter preference for ratios below 0.25. This careful capital structure offers stability in economic declines.
-
Strong Profitability: Dorman's return on equity of 16.14% is higher than Lynch's 15% minimum need, showing good use of shareholder money to create earnings.
-
Liquidity Position: The current ratio of 2.74 shows good short-term financial flexibility, much higher than Lynch's minimum need of 1.0 and giving operational strength.
Fundamental Assessment
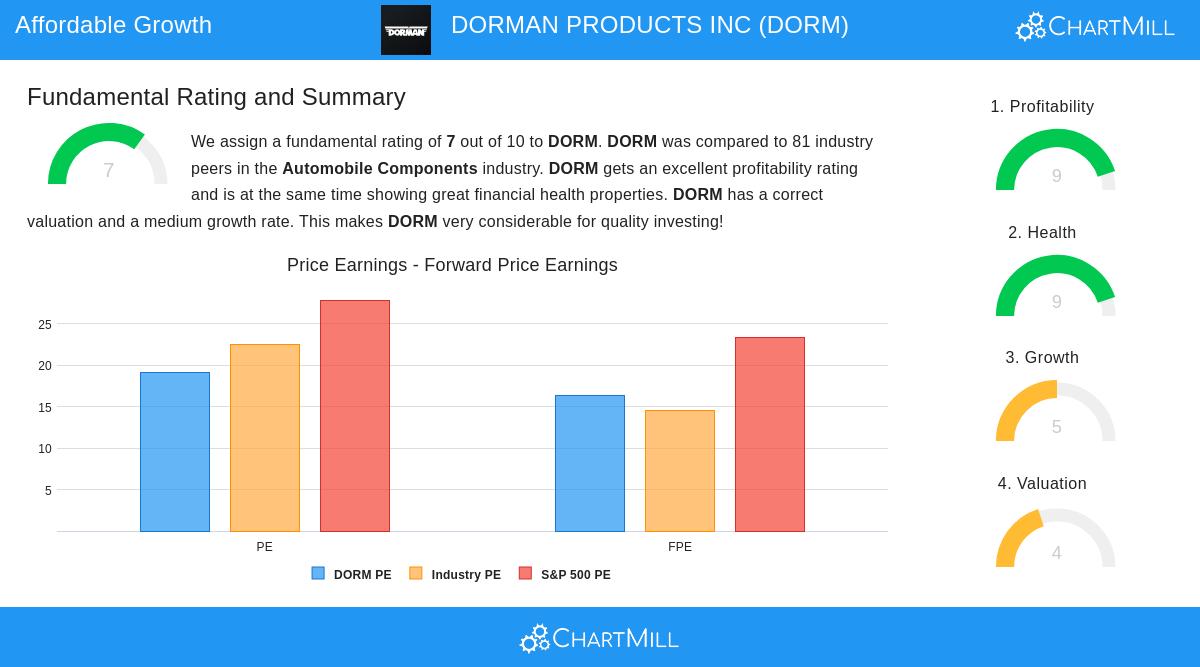
The full fundamental analysis report gives Dorman Products an overall rating of 7 out of 10, with especially good performances in profitability (9/10) and financial health (9/10). The company does well in several key areas that match Lynch's idea of investing in financially stable businesses.
Profitability measures are particularly good, with Dorman doing better than over 90% of its automobile components industry peers in return on assets (9.14%), return on equity (16.14%), and operating margin (15.75%). More significantly, these margins have shown steady improvement in recent years, pointing to gains in operational efficiency rather than short-term lifts.
The health rating shows a company with a firm balance sheet, including an Altman-Z score of 5.14 suggesting very low bankruptcy risk and a debt-to-free-cash-flow ratio of 3.31 that would let the company pay off all debt in just over three years using current cash flow levels. These measures provide the financial steadiness Lynch saw as necessary for long-term compounding.
Business Model Considerations
Dorman works in what Lynch might call a "simple" sector, automotive replacement parts, which fits with his liking for understandable businesses not in Wall Street's focus. The company serves the motor vehicle aftermarket industry through three parts: Light Duty, Heavy Duty, and Specialty Vehicle parts. This spread across vehicle types gives revenue steadiness, while the necessary nature of replacement parts offers defensive traits in economic declines.
The company's focus on supplying both replacement and upgrade parts places it to gain from multiple trends, including the older vehicle fleet in the United States and the increasing complication of modern automotive systems that often make OEM parts very costly. Dorman's value idea centers on giving economical options without losing quality, a business model that appeals to cost-aware consumers and repair shops.
Growth Path and Valuation Balance
While past growth has been notable, analysts expect slower growth ahead, with EPS projected to rise by 7.80% each year and revenue by 6.18%. This slowing from past rates actually fits with Lynch's preference for maintainable rather than rapid growth, as it lowers the risk of letdown. The current valuation multiples seem fair in this situation, with a P/E ratio of 19.07 comparing well to the S&P 500 average of 27.86.
The company's share buyback program, shown by lower shares outstanding compared to both one and five years ago, represents another Lynch-supported use of capital that improves per-share value over time. This careful capital allocation, mixed with good operational execution, creates a solid case for long-term compounding.
For investors interested in examining other companies that meet the Peter Lynch criteria, the complete screening results give more investment ideas filtered through this established methodology.
Disclaimer: This analysis is based on publicly available information and is given for educational purposes only. It does not form investment advice, and readers should do their own research and talk with financial advisors before making investment decisions. Past performance does not guarantee future results.