
Consider COTERRA ENERGY INC (NYSE:CTRA) as a top value stock, identified by our stock screening tool. CTRA shines in terms of profitability, solvency, and liquidity, all while remaining very reasonably priced. Let's dive deeper into the analysis.
Looking at the Valuation
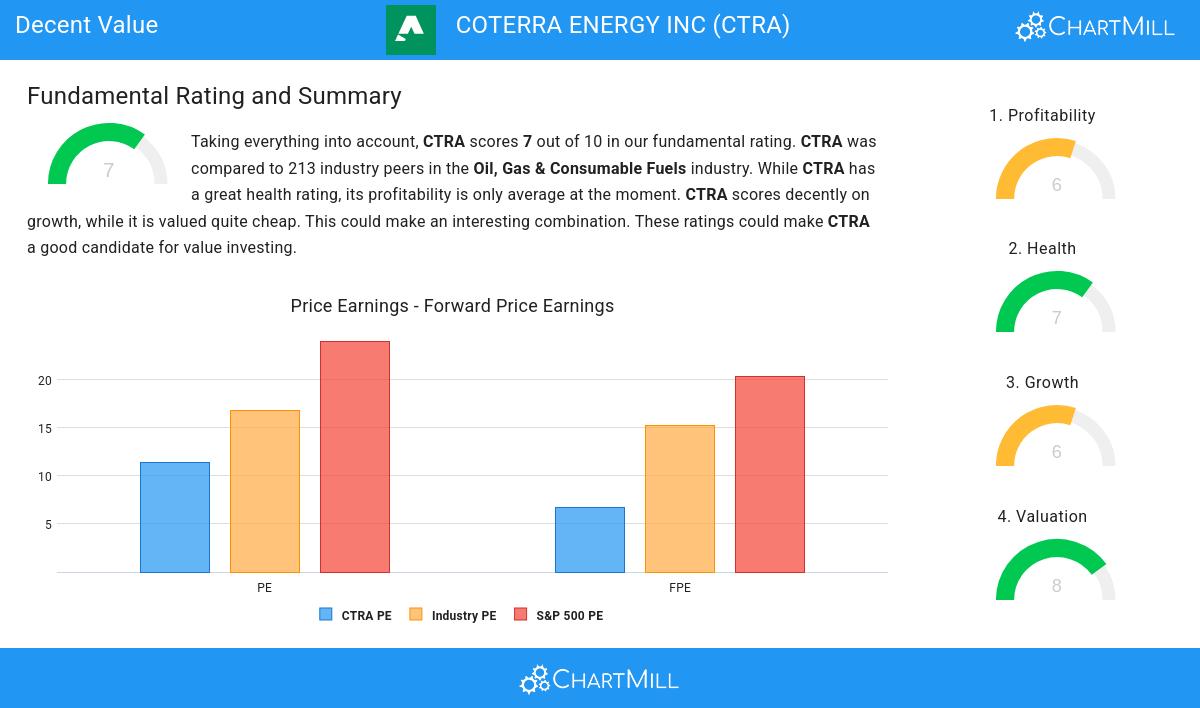
ChartMill assigns a Valuation Rating to each stock, ranging from 0 to 10. This rating is calculated by analyzing different valuation elements, such as price to earnings and free cash flow, both in absolute terms and relative to the market and industry. In the case of CTRA, the assigned 8 reflects its valuation:
- A Price/Earnings ratio of 11.41 indicates a reasonable valuation of CTRA.
- CTRA's Price/Earnings ratio is a bit cheaper when compared to the industry. CTRA is cheaper than 61.03% of the companies in the same industry.
- The average S&P500 Price/Earnings ratio is at 23.99. CTRA is valued rather cheaply when compared to this.
- With a Price/Forward Earnings ratio of 6.70, the valuation of CTRA can be described as very cheap.
- Compared to the rest of the industry, the Price/Forward Earnings ratio of CTRA indicates a somewhat cheap valuation: CTRA is cheaper than 77.93% of the companies listed in the same industry.
- The average S&P500 Price/Forward Earnings ratio is at 20.35. CTRA is valued rather cheaply when compared to this.
- Based on the Enterprise Value to EBITDA ratio, CTRA is valued a bit cheaper than the industry average as 65.26% of the companies are valued more expensively.
- The low PEG Ratio(NY), which compensates the Price/Earnings for growth, indicates a rather cheap valuation of the company.
- CTRA has a very decent profitability rating, which may justify a higher PE ratio.
- CTRA's earnings are expected to grow with 30.09% in the coming years. This may justify a more expensive valuation.
Understanding CTRA's Profitability
ChartMill's Profitability Rating offers a unique perspective on stock analysis, providing scores from 0 to 10. These ratings consider a wide range of profitability metrics and margins, both in comparison to industry peers and on their own merits. For CTRA, the assigned 6 is a significant indicator of profitability:
- The last Return On Invested Capital (5.40%) for CTRA is well below the 3 year average (12.27%), which needs to be investigated, but indicates that CTRA had better years and this may not be a problem.
- The Profit Margin of CTRA (20.52%) is better than 72.30% of its industry peers.
- With an excellent Gross Margin value of 80.21%, CTRA belongs to the best of the industry, outperforming 89.67% of the companies in the same industry.
- In the last couple of years the Gross Margin of CTRA has grown nicely.
Understanding CTRA's Health Score
ChartMill assigns a Health Rating to every stock. This score ranges from 0 to 10 and evaluates the different health aspects like liquidity and solvency, both absolutely, but also relative to the industry peers. CTRA scores a 7 out of 10:
- CTRA's Altman-Z score of 2.18 is fine compared to the rest of the industry. CTRA outperforms 75.12% of its industry peers.
- The Debt to FCF ratio of CTRA is 3.46, which is a good value as it means it would take CTRA, 3.46 years of fcf income to pay off all of its debts.
- CTRA has a better Debt to FCF ratio (3.46) than 75.12% of its industry peers.
- CTRA has a Debt/Equity ratio of 0.27. This is a healthy value indicating a solid balance between debt and equity.
- CTRA's Debt to Equity ratio of 0.27 is fine compared to the rest of the industry. CTRA outperforms 65.73% of its industry peers.
- CTRA has a Current Ratio of 2.92. This indicates that CTRA is financially healthy and has no problem in meeting its short term obligations.
- CTRA's Current ratio of 2.92 is amongst the best of the industry. CTRA outperforms 82.63% of its industry peers.
- CTRA has a Quick Ratio of 2.88. This indicates that CTRA is financially healthy and has no problem in meeting its short term obligations.
- The Quick ratio of CTRA (2.88) is better than 84.51% of its industry peers.
Growth Examination for CTRA
Every stock receives a Growth Rating from ChartMill, ranging from 0 to 10. This rating assesses various growth aspects, including historical and projected EPS and revenue growth. CTRA boasts a 6 out of 10:
- The Revenue has been growing by 21.44% on average over the past years. This is a very strong growth!
- The Earnings Per Share is expected to grow by 29.57% on average over the next years. This is a very strong growth
- The Revenue is expected to grow by 16.07% on average over the next years. This is quite good.
- The EPS growth rate is accelerating: in the next years the growth will be better than in the last years.
Every day, new Decent Value stocks can be found on ChartMill in our Decent Value screener.
For an up to date full fundamental analysis you can check the fundamental report of CTRA
Keep in mind
Important Note: The content of this article is not intended as trading advice. It is essential to perform your own analysis and exercise caution when making trading decisions. The article presents observations created by automated analysis but does not guarantee any trading or investment outcomes. Always trade responsibly and make independent judgments.