
Some mean reversion swing tradings ideas before market opening
Last update: Sep 14, 2022
After yesterday's extremely red stock market day, we noticed that ChartMill spotted quite a few stocks that previously showed an upward breakout but fell back below their breakout levels after yesterday's session.
This screen shows all US stocks with a minimum price of $5 and an average trading volume higher than 500,000. In addition, only stocks whose price is below the 200-day average are held and thus we can assume that the long-term trend is downward.
For the rest, there are three specific custom filters based on the bollinger bands.
-
The first custom filter stipulates that the close of the previous candle must be higher than the upper bollinger band.
-
The second custom filter stipulates that the closing price of the most recent candle must be lower than the low of the previous candle.
This filter combination gives 90 results.
- To refine it further, one additional custom filter was added with the condition that yesterday's high must equal the highest price of the past 20 days. This way, emphasis is placed on stocks that had only recently broken out.
This brings the number of results to 27 which you can consult here.
Please note, for this link a historical date was set to 2022-09-13 so that you can continue to see the results that came out of the screener by then, so the screen does not automatically adjust to the most recent closing prices. If you wish to do so, simply remove the historical date via the general tab of the stock screener page.
Let's take a closer look at some interesting swing trading setups.
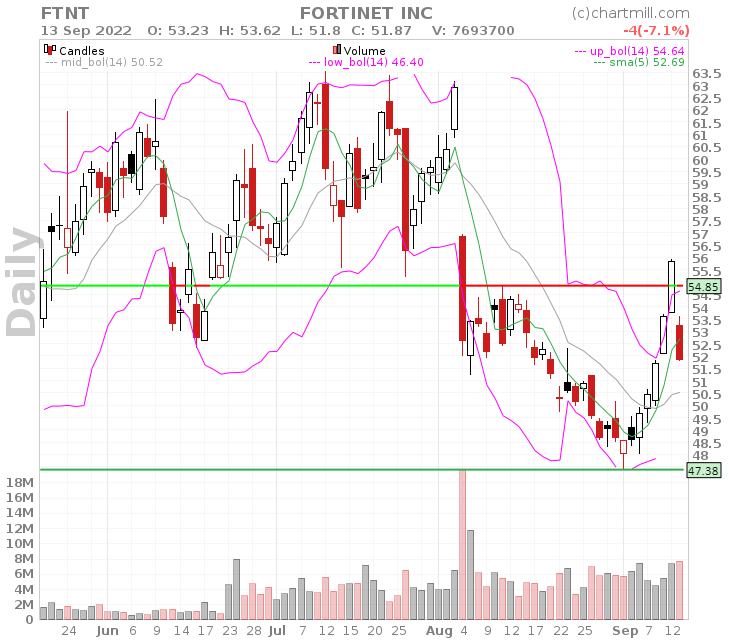
Fortinet has had a strong rise and the day before yesterday it was trading at its highest price since August 11. Yesterday, however, the stock opened with quite a gap down and ended up closing more than 7% lower with significant selling volume. First support around $47.5 is in sight if the price can break yesterday's low.
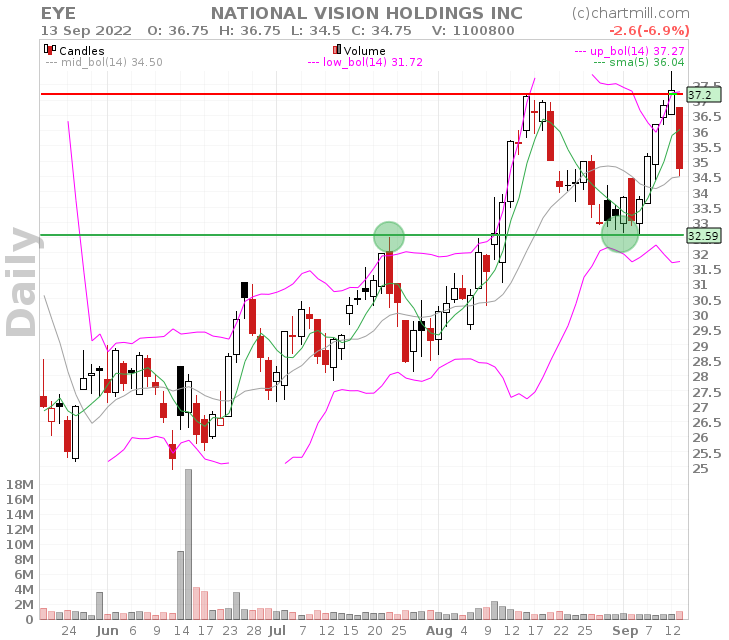
Nation Vision Holdings had also risen sharply since early September and the stock was able to close above the high of August 16 last Monday. Yesterday then saw the formation of a very long bearish candle and a drop of almost 7%. First support is around $33.60. In terms of risk/reward certainly not the best candidate but worth keeping an eye on if the price falls below the current low.
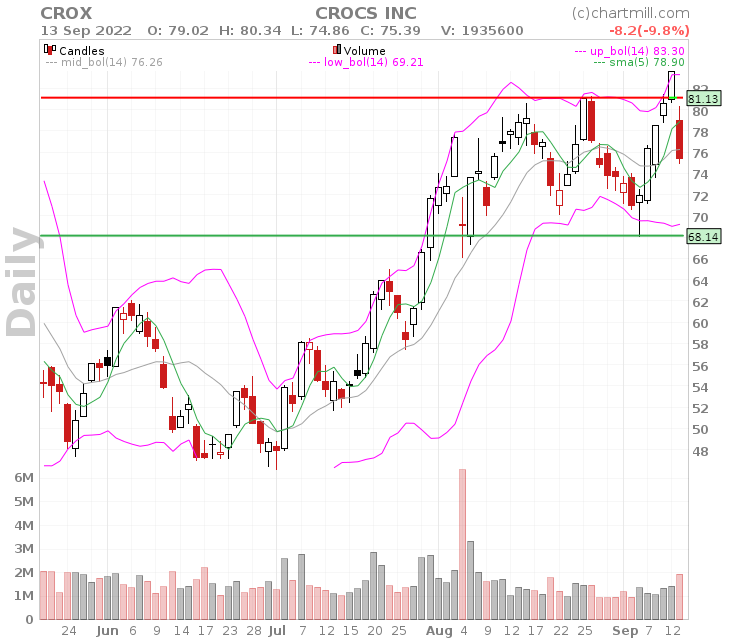
Crox: A textbook example of a nice breakout the day before yesterday but disappointing inflation figures prevented a further rise in this stock as well. The price opened yesterday with a large gap down and eventually went down almost 10%. We will have to wait and see if yesterday's low can be broken today. In that case, the road is clear to the $68.15 level.
Disclaimer: These trading ideas are merely to demonstrate what ChartMill is capable of and shows some typical results of a breakout filter. It is in no way actual financial advise to invest or trade in these stocks. The author has no pre-existing position in any of these stocks.
109.77
-0.88 (-0.8%)
97.42
-0.32 (-0.33%)
17.17
+0.49 (+2.94%)
Find more stocks in the Stock Screener
CROX Latest News and Analysis
 4 days ago - ChartmillIn a market where value is scarce, CROCS INC (NASDAQ:CROX) offers a refreshing opportunity with its solid fundamentals.
CROCS INC is a hidden gem, featuring undervaluation and robust fundamentals. NASDAQ:CROX showcases decent financial health and profitability, coupled with an attractive price.
