
Our stock screening tool has pinpointed CROCS INC (NASDAQ:CROX) as an undervalued stock. CROX maintains a solid financial footing. Furthermore, it remains attractively priced. Let's delve into the specifics below.
Understanding CROX's Valuation
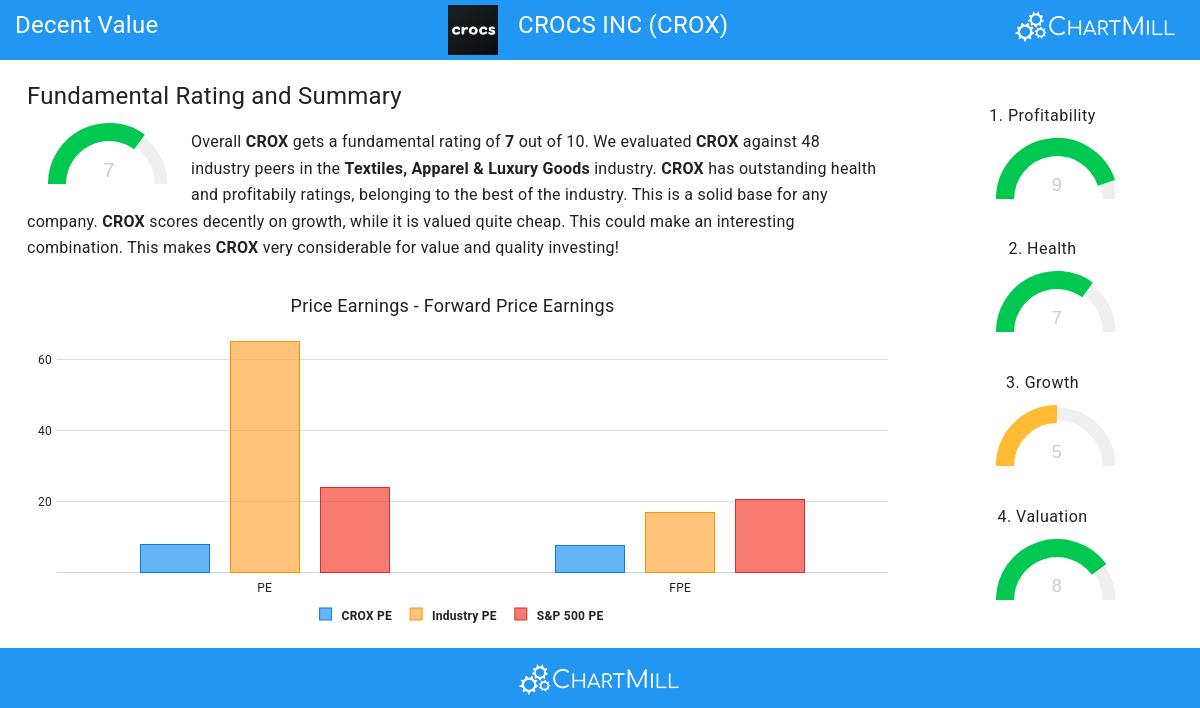
ChartMill assigns a Valuation Rating to every stock. This score ranges from 0 to 10 and evaluates the different valuation aspects and compares the price to earnings and cash flows, while taking into account profitability and growth. CROX scores a 8 out of 10:
- A Price/Earnings ratio of 7.66 indicates a rather cheap valuation of CROX.
- Based on the Price/Earnings ratio, CROX is valued cheaper than 85.42% of the companies in the same industry.
- When comparing the Price/Earnings ratio of CROX to the average of the S&P500 Index (23.99), we can say CROX is valued rather cheaply.
- A Price/Forward Earnings ratio of 7.59 indicates a rather cheap valuation of CROX.
- Based on the Price/Forward Earnings ratio, CROX is valued cheaper than 91.67% of the companies in the same industry.
- Compared to an average S&P500 Price/Forward Earnings ratio of 20.35, CROX is valued rather cheaply.
- Based on the Enterprise Value to EBITDA ratio, CROX is valued cheaply inside the industry as 81.25% of the companies are valued more expensively.
- Compared to the rest of the industry, the Price/Free Cash Flow ratio of CROX indicates a rather cheap valuation: CROX is cheaper than 81.25% of the companies listed in the same industry.
- CROX has an outstanding profitability rating, which may justify a higher PE ratio.
What does the Profitability looks like for CROX
ChartMill utilizes a Profitability Rating to assess stocks, scoring them on a scale of 0 to 10. This rating takes into account a variety of profitability ratios and margins, both in absolute terms and in comparison to industry peers. CROX has earned a 9 out of 10:
- Looking at the Return On Assets, with a value of 19.74%, CROX belongs to the top of the industry, outperforming 91.67% of the companies in the same industry.
- Looking at the Return On Equity, with a value of 51.75%, CROX belongs to the top of the industry, outperforming 93.75% of the companies in the same industry.
- CROX's Return On Invested Capital of 23.23% is amongst the best of the industry. CROX outperforms 87.50% of its industry peers.
- Measured over the past 3 years, the Average Return On Invested Capital for CROX is significantly above the industry average of 13.58%.
- The 3 year average ROIC (22.59%) for CROX is below the current ROIC(23.23%), indicating increased profibility in the last year.
- With an excellent Profit Margin value of 23.16%, CROX belongs to the best of the industry, outperforming 97.92% of the companies in the same industry.
- In the last couple of years the Profit Margin of CROX has grown nicely.
- CROX has a better Operating Margin (25.50%) than 97.92% of its industry peers.
- CROX's Operating Margin has improved in the last couple of years.
- CROX has a better Gross Margin (58.76%) than 72.92% of its industry peers.
- CROX's Gross Margin has improved in the last couple of years.
Assessing Health Metrics for CROX
To gauge a stock's financial health, ChartMill utilizes a Health Rating on a scale of 0 to 10. This comprehensive evaluation encompasses liquidity and solvency, both in absolute terms and in comparison to industry peers. CROX has earned a 7 out of 10:
- An Altman-Z score of 3.76 indicates that CROX is not in any danger for bankruptcy at the moment.
- Looking at the Altman-Z score, with a value of 3.76, CROX is in the better half of the industry, outperforming 68.75% of the companies in the same industry.
- CROX has a debt to FCF ratio of 1.46. This is a very positive value and a sign of high solvency as it would only need 1.46 years to pay back of all of its debts.
- CROX has a better Debt to FCF ratio (1.46) than 81.25% of its industry peers.
- Even though the debt/equity ratio score it not favorable for CROX, it has very limited outstanding debt, so we won't put too much weight on the DE evaluation.
- The current and quick ratio evaluation for CROX is rather negative, while it does have excellent solvency and profitability. These ratios do not necessarly indicate liquidity issues and need to be evaluated against the specifics of the business.
Growth Analysis for CROX
Every stock receives a Growth Rating from ChartMill, ranging from 0 to 10. This rating assesses various growth aspects, including historical and projected EPS and revenue growth. CROX boasts a 5 out of 10:
- CROX shows a strong growth in Earnings Per Share. In the last year, the EPS has been growing by 9.31%, which is quite good.
- CROX shows a strong growth in Earnings Per Share. Measured over the last years, the EPS has been growing by 51.64% yearly.
- CROX shows a strong growth in Revenue. Measured over the last years, the Revenue has been growing by 27.23% yearly.
Our Decent Value screener lists more Decent Value stocks and is updated daily.
Our latest full fundamental report of CROX contains the most current fundamental analsysis.
Disclaimer
Important Note: The content of this article is not intended as trading advice. It is essential to perform your own analysis and exercise caution when making trading decisions. The article presents observations created by automated analysis but does not guarantee any trading or investment outcomes. Always trade responsibly and make independent judgments.