
Our stock screener has flagged COSTCO WHOLESALE CORP (NASDAQ:COST) as a potential breakout candidate. This occurs when the stock shows signs of consolidation after a notable upward trend. While we can't predict the actual breakout, it's worth monitoring NASDAQ:COST for potential movement.
Technical Analysis Observations
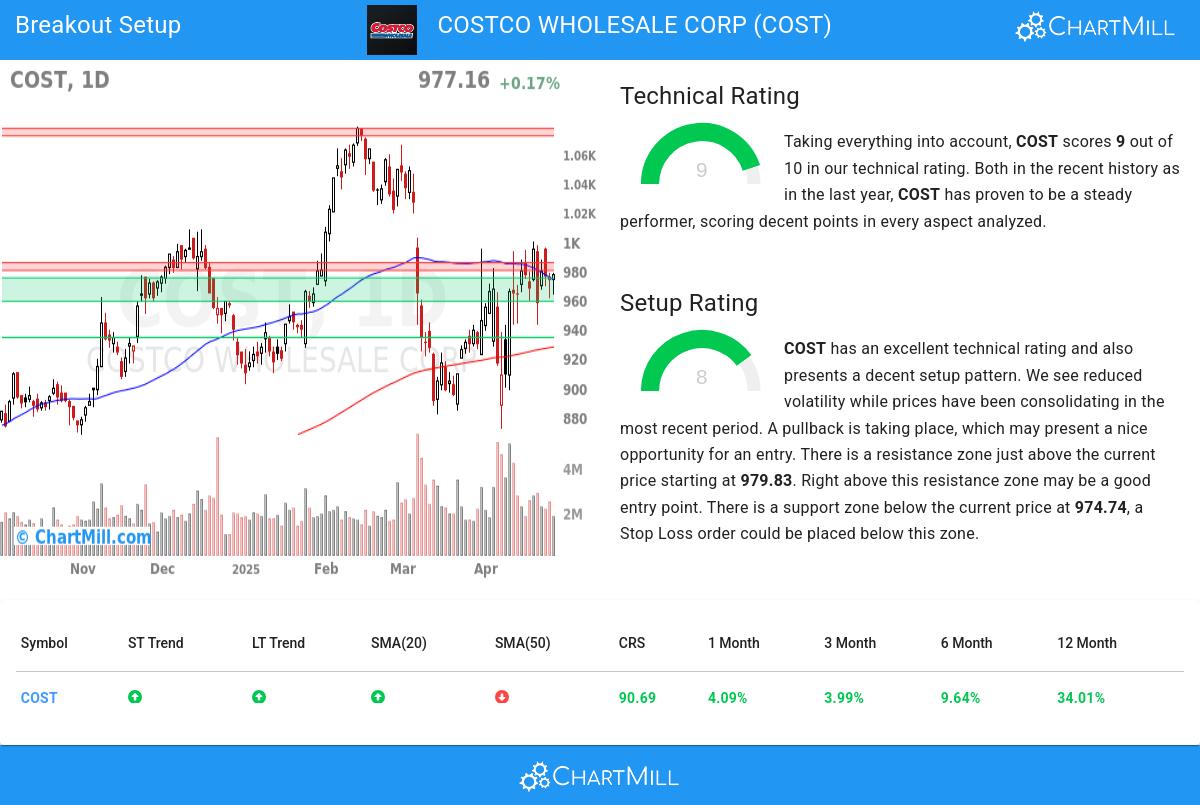
ChartMill assigns a proprietary Technical Rating to each stock. The score is computed daily by evaluating various technical indicators and properties. The score ranges from 0 to 10.
Overall COST gets a technical rating of 9 out of 10. This is due to a consistent performance in both the short and longer term time frames. Also compared to the overall market, COST is showing a nice and steady performance.
- Both the short term and long term trends are positive. This is a very positive sign.
- When comparing the yearly performance of all stocks, we notice that COST is one of the better performing stocks in the market, outperforming 90% of all stocks. On top of that, COST also shows a nice and consistent pattern of rising prices.
- COST is currently trading in the upper part of its 52 week range. The market is still in the middle of its 52 week range, so COST slightly outperforms the market at the moment.
- In the last month COST has a been trading in the 871.71 - 999.92 range, which is quite wide. It is currently trading near the high of this range.
- COST is part of the Consumer Staples Distribution & Retail industry. There are 40 other stocks in this industry, COST did better than 64% of them.
Our latest full technical report of COST contains the most current technical analsysis.
How does the Setup look for COST
Besides the Technical Rating, ChartMill also assign a Setup Rating to every stock. This setup score also ranges from 0 to 10 and determines to which extend the stock is consolidating. This is achieved by evaluating multiple short term technical indicators. COST currently has a 8 as setup rating:
Besides having an excellent technical rating, COST also presents a decent setup pattern. Prices have been consolidating lately and the volatility has been reduced. A pullback is taking place, which may present a nice opportunity for an entry. There is a resistance zone just above the current price starting at 979.83. Right above this resistance zone may be a good entry point. There is a support zone below the current price at 974.74, a Stop Loss order could be placed below this zone.
How to trade COST?
To potentially initiate a trade, it is common practice to wait for the stock to break out of the consolidation zone. This breakout signifies a potential upward movement, and traders may enter the stock at that point. Conversely, if the stock falls back below the consolidation zone, it may be sold at a loss.
Please note that this article should not be construed as trading advice. The information provided is solely based on automated technical analysis and serves to highlight technical observations. It is important to conduct your own analysis and make trading decisions based on your own judgment and responsibility.
Every day, new breakout setups can be found on ChartMill in our Breakout screener.
Disclaimer
Important Note: The content of this article is not intended as trading advice. It is essential to perform your own analysis and exercise caution when making trading decisions. The article presents observations created by automated analysis but does not guarantee any trading or investment outcomes. Always trade responsibly and make independent judgments.