
Technical breakout strategies focus on finding stocks with solid momentum that are pausing before their next rise. By using a high ChartMill Technical Rating (which measures trend strength) along with a high Setup Quality Rating (which measures consolidation quality), traders can spot stocks likely to break out. CITIGROUP INC (NYSE:C) currently fits this profile, with a top score of 10 for technical strength and 9 for setup quality.
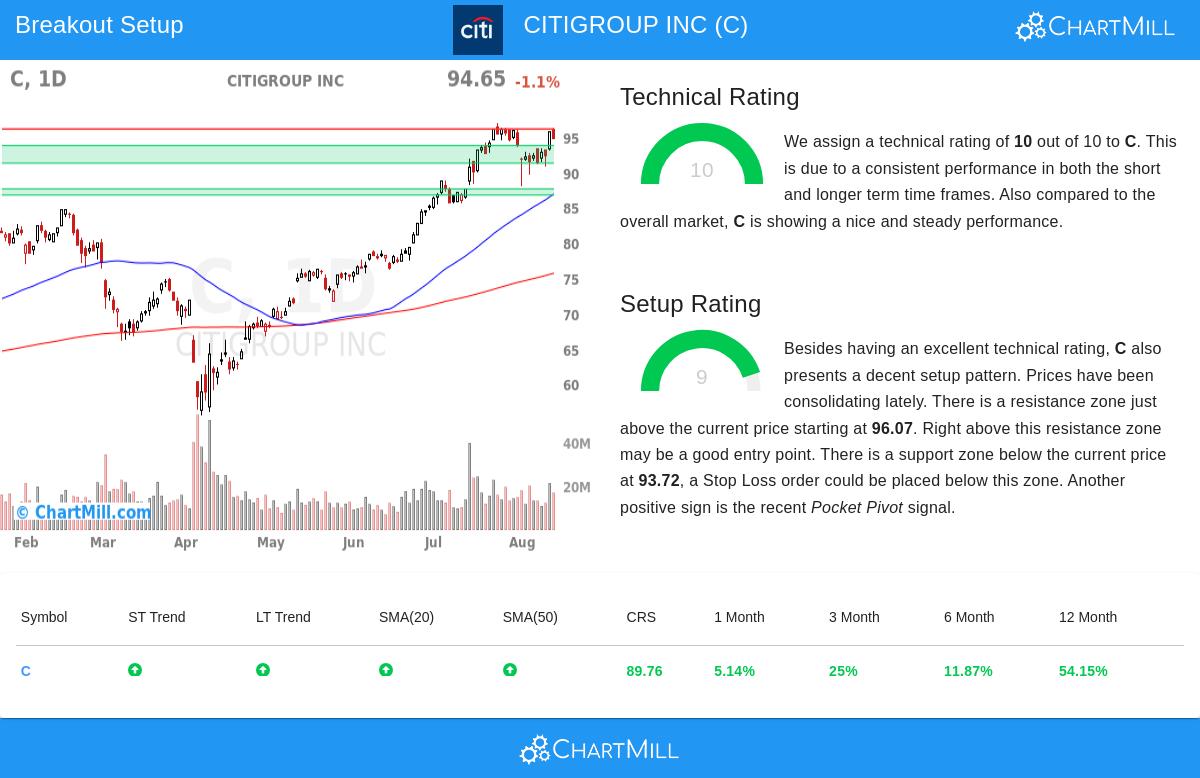
Technical Strength: Why C Scores a Perfect 10
The ChartMill Technical Rating checks several factors to judge a stock’s trend health:
- Consistent trend alignment: C displays positive trends in both short-term and long-term periods, with all key moving averages (20-day, 50-day, 100-day, and 200-day) moving up. This multi-timeframe agreement lowers the chance of false breakouts.
- Better performance than peers: The stock has done better than 89% of all stocks over the past year and 96% of banking sector stocks, indicating leadership that often leads to continued gains.
- Strong momentum: Trading close to its 52-week high (current price $94.65 vs. high of $96.91) with steady increases—up 25% in 3 months and 54% in 12 months.
These elements create what technical analysts call a "strong trend"—when multiple timeframes and metrics agree on the same upward direction. The full technical report includes more indicators of strength, such as clear support and resistance levels.
Setup Quality: The 9/10 Consolidation Pattern
While technical strength finds good stocks, setup quality finds good entry points. C’s high 9/10 setup score reflects:
- Narrow consolidation: The stock has moved between $87.94 and $96.91 over the past month, now testing the upper limit. This tight range often comes before a bigger move.
- Clear support areas: Five support levels below the current price, with the closest at $93.72-$91.23, offering a logical stop-loss zone.
- Pocket pivot signal: A recent pattern where the price rose on higher volume than previous down days, hinting at institutional buying.
- Breakout potential: Immediate resistance at $96.07, with a move above possibly leading to more gains.
The setup forms what technicians call a "high base" pattern—where a stock pauses near highs instead of pulling back sharply, often a sign of strength. The mix of shallow dips and tight trading ranges raises the odds of a successful breakout.
Trading Considerations
The automated analysis suggests:
- Possible entry above resistance at $96.08 (buy stop)
- Stop loss below support at $91.22 (5.06% risk)
- Suggested position size of 19.77% of capital for 1% portfolio risk
While the pattern looks promising, traders should:
- Watch banking sector trends, given C’s top industry ranking
- Look for higher volume on breakout attempts
- Consider earnings dates and broader economic factors affecting financial stocks
For those searching for similar breakout opportunities, the Technical Breakout Setups screen updates daily with new candidates meeting these strict technical criteria.
Disclaimer: This analysis is based on technical factors only and should not be considered investment advice. Always conduct your own research and consider risk management strategies before trading.