
Our stock screening tool has pinpointed BRISTOL-MYERS SQUIBB CO (NYSE:BMY) as an undervalued stock option. BMY retains a strong financial foundation and an attractive price tag. Let's delve into the specifics below.
A Closer Look at Valuation for BMY
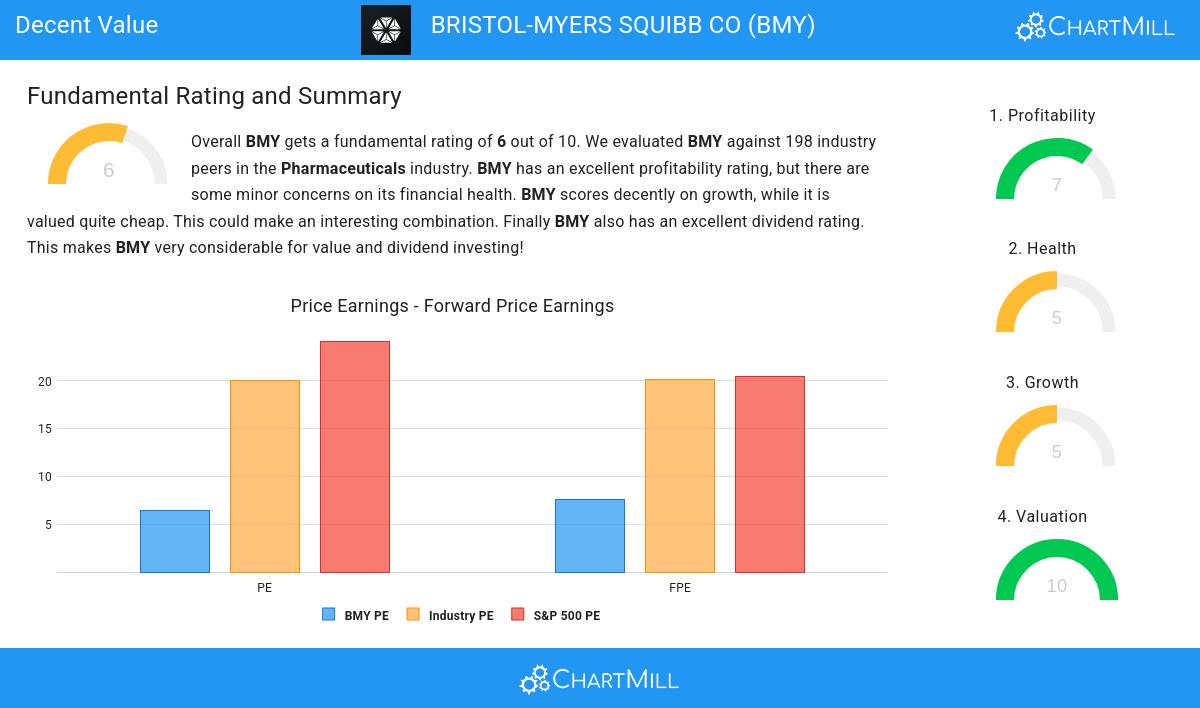
ChartMill provides a Valuation Rating to every stock, ranging from 0 to 10. This rating assesses various valuation aspects, comparing price to earnings and cash flows, while considering factors like profitability and growth. BMY boasts a 10 out of 10:
- The Price/Earnings ratio is 6.39, which indicates a rather cheap valuation of BMY.
- Based on the Price/Earnings ratio, BMY is valued cheaper than 94.95% of the companies in the same industry.
- When comparing the Price/Earnings ratio of BMY to the average of the S&P500 Index (24.12), we can say BMY is valued rather cheaply.
- The Price/Forward Earnings ratio is 7.60, which indicates a rather cheap valuation of BMY.
- BMY's Price/Forward Earnings ratio is rather cheap when compared to the industry. BMY is cheaper than 90.91% of the companies in the same industry.
- When comparing the Price/Forward Earnings ratio of BMY to the average of the S&P500 Index (20.42), we can say BMY is valued rather cheaply.
- BMY's Enterprise Value to EBITDA ratio is rather cheap when compared to the industry. BMY is cheaper than 90.91% of the companies in the same industry.
- Based on the Price/Free Cash Flow ratio, BMY is valued cheaply inside the industry as 92.93% of the companies are valued more expensively.
- The low PEG Ratio(NY), which compensates the Price/Earnings for growth, indicates a rather cheap valuation of the company.
- The decent profitability rating of BMY may justify a higher PE ratio.
- BMY's earnings are expected to grow with 75.28% in the coming years. This may justify a more expensive valuation.
Exploring BMY's Profitability
ChartMill employs its own Profitability Rating system for stock evaluation. This score, ranging from 0 to 10, is derived from an analysis of diverse profitability metrics and margins. In the case of BMY, the assigned 7 is noteworthy for profitability:
- With an excellent Return On Assets value of 5.86%, BMY belongs to the best of the industry, outperforming 90.40% of the companies in the same industry.
- Looking at the Return On Equity, with a value of 31.16%, BMY belongs to the top of the industry, outperforming 95.45% of the companies in the same industry.
- With an excellent Return On Invested Capital value of 14.88%, BMY belongs to the best of the industry, outperforming 90.91% of the companies in the same industry.
- The last Return On Invested Capital (14.88%) for BMY is above the 3 year average (12.29%), which is a sign of increasing profitability.
- BMY's Profit Margin of 11.38% is amongst the best of the industry. BMY outperforms 87.37% of its industry peers.
- The Operating Margin of BMY (27.11%) is better than 91.41% of its industry peers.
- BMY has a Gross Margin of 74.69%. This is amongst the best in the industry. BMY outperforms 80.30% of its industry peers.
ChartMill's Evaluation of Health
ChartMill employs a unique Health Rating system for all stocks. This rating, ranging from 0 to 10, is determined by analyzing various liquidity and solvency ratios. For BMY, the assigned 5 for health provides valuable insights:
- BMY's Altman-Z score of 2.07 is fine compared to the rest of the industry. BMY outperforms 68.69% of its industry peers.
- The Debt to FCF ratio of BMY is 3.80, which is a good value as it means it would take BMY, 3.80 years of fcf income to pay off all of its debts.
- With an excellent Debt to FCF ratio value of 3.80, BMY belongs to the best of the industry, outperforming 86.87% of the companies in the same industry.
Growth Assessment of BMY
To evaluate a stock's growth potential, ChartMill utilizes a Growth Rating on a scale of 0 to 10. This comprehensive assessment considers various growth aspects, including historical and estimated EPS and revenue growth. BMY has achieved a 5 out of 10:
- The Earnings Per Share has grown by an impressive 599.05% over the past year.
- The Revenue has been growing by 13.06% on average over the past years. This is quite good.
- BMY is expected to show a strong growth in Earnings Per Share. In the coming years, the EPS will grow by 38.96% yearly.
- When comparing the EPS growth rate of the last years to the growth rate of the upcoming years, we see that the growth is accelerating.
Our Decent Value screener lists more Decent Value stocks and is updated daily.
Check the latest full fundamental report of BMY for a complete fundamental analysis.
Disclaimer
This article should in no way be interpreted as advice. The article is based on the observed metrics at the time of writing, but you should always make your own analysis and trade or invest at your own responsibility.