
Broadcom Inc (NASDAQ:AVGO) Combines Strong Fundamentals with Technical Breakout Potential
By Mill Chart
Last update: Oct 6, 2025
Combining basic strength with technical momentum represents a strong method for finding growth stocks positioned for continued strong performance. This approach focuses on companies showing sound financial health and quickening earnings, while also displaying positive chart patterns that point to institutional buying and breakout possibility. By selecting for stocks with solid growth traits that also show interesting technical formations, investors can find opportunities where basic drivers match with positive price momentum.
Broadcom Inc (NASDAQ:AVGO) appears as an interesting candidate through this analytical view. The semiconductor and infrastructure software leader shows the exact mix of strong growth measures and technical breakout formations that this strategy looks for.
Fundamental Growth Strength
Broadcom's fundamental profile shows very good growth traits that build the base of its investment case. The company's growth score of 9/10 shows quickening business momentum across several time periods.
- Earnings Per Share increased 38.52% over the past year with a 17.90% average yearly growth rate over recent years
- Revenue grew 28.01% in the last year with a 17.94% average yearly growth path
- Future estimates point to quickening growth with EPS expected to rise 33.02% each year and revenue predicted to increase 24.71%
These measures show the company's ability to not just maintain growth but actually quicken its expansion speed. For growth investors, this quickening pattern is especially important as it indicates the company is gaining market position and improving operational efficiency at the same time. The fundamental analysis report available through ChartMill's detailed assessment further supports Broadcom's standing within the top group of semiconductor companies regarding growth measures.
Profitability and Financial Health
Beyond just growth, Broadcom shows excellent profitability that backs its high valuation. With a profitability score of 9/10, the company creates industry-leading margins and returns on capital.
- Operating Margin of 39.20% does better than 96.43% of industry competitors
- Return on Equity of 25.84% puts it in the top 10% of the semiconductor field
- Gross Margin of 67.03% shows significant pricing ability and competitive benefits
The company's financial health score of 5/10 shows a more varied picture, with sound solvency measures balanced by notable liquidity ratios. The Altman-Z score of 11.31 points to low bankruptcy danger, and the debt-to-FCF ratio of 2.58 indicates manageable leverage. However, current and quick ratios below industry averages need watching, especially in a period of rising interest rates. This balanced health profile is common for growth companies putting money back aggressively into expansion rather than keeping high liquidity.
Technical Breakout Formation
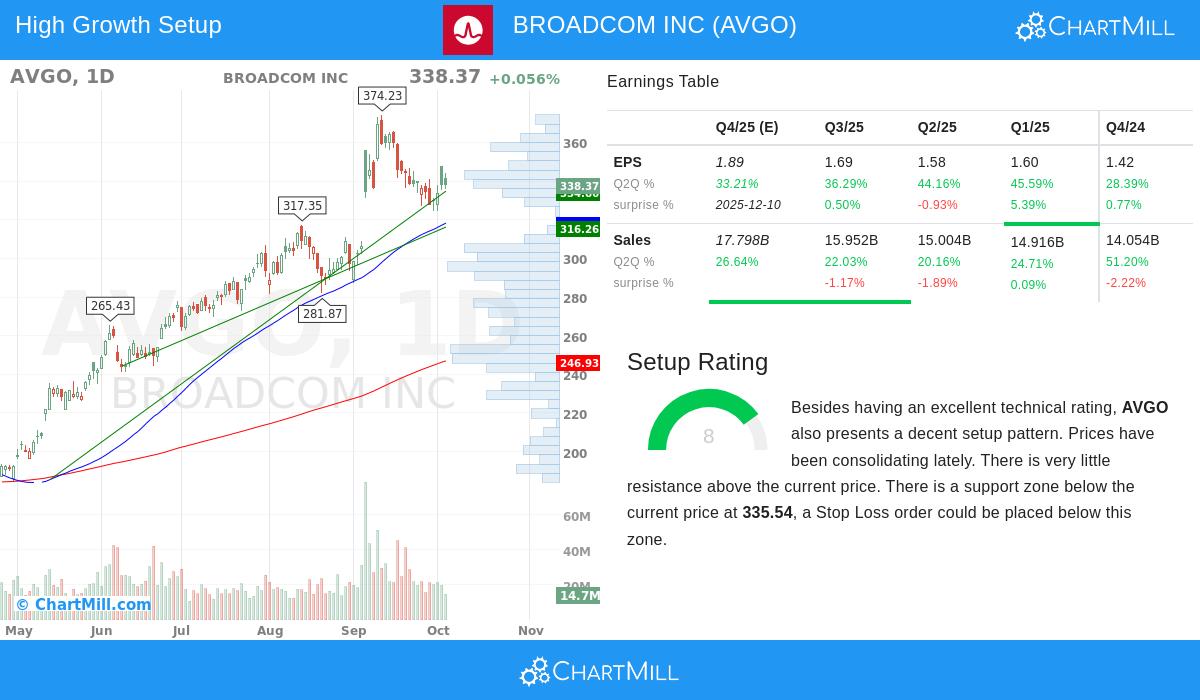
From a technical viewpoint, Broadcom presents an interesting setup with a complete technical score of 10/10 and a setup score of 8/10. The stock shows several features that technical analysts prefer for breakout candidates.
- Both long-term and short-term trends stay clearly positive across all time periods
- The stock shows relative strength doing better than 92% of all stocks and 79% of semiconductor peers
- Three separate support zones give technical bases at $335.54, $327.89, and $318.29
- Very little overhead resistance suggests easy movement if the stock moves above recent consolidation
The technical analysis report points out Broadcom's position trading in the higher part of its 52-week range while keeping strong momentum traits. The coming together of several moving averages in upward-sloping patterns confirms the stock's technical soundness and indicates institutional buying.
Strategic Fit
The mix of Broadcom's fundamental growth quickening and technical breakout formation creates an interesting investment thesis. The company's leadership in semiconductor solutions and infrastructure software places it at the crossing of several technology major trends, including cloud computing, 5G deployment, and artificial intelligence. Its target market includes almost every growing technology area, providing the wide addressable market that growth investors look for.
Management's history of strategic execution, shown by steady margin growth and successful integration of purchases, shows the qualitative leadership needed to maintain competitive benefits. The company's ability to keep premium pricing ability through proprietary technology solutions supports both its exceptional profitability and future growth prospects.
For investors looking for more opportunities that fit this strict mix of fundamental strength and technical momentum, look at more solid growth stocks with positive technical setups through ChartMill's specialized screening tools.
Disclaimer: This analysis is for informational purposes only and does not constitute investment advice, recommendation, or endorsement of any security. Investors should conduct their own research and consult with a financial advisor before making investment decisions. Past performance is not indicative of future results.
338.37
+0.19 (+0.06%)
Find more stocks in the Stock Screener
AVGO Latest News and Analysis


