
A systematic method for finding high-potential growth stocks combines strict technical analysis with fundamental momentum measures. The method uses Mark Minervini's Trend Template to confirm stocks show strong technical condition and are situated in clear uptrends, while also filtering for securities showing outstanding growth traits via a High Growth Momentum rating. This two-step process finds companies that not only display positive price movement but also have the fundamental business momentum needed to support continued gains.
Technical Strength and Trend Template Alignment
AMPHENOL CORP-CL A (NYSE:APH) presents a strong technical image that matches Minervini's standards for finding stocks in solid uptrends. The Trend Template demands stocks show strength over several moving average periods and price levels compared to their 52-week range, all points that APH meets.
The stock's present technical setup shows several main points of strength:
- Price Position vs. Moving Averages: Current price of $123.58 trades well above the rising 50-day SMA ($113.46), 150-day SMA ($91.80), and 200-day SMA ($86.46)
- Moving Average Alignment: The 50-day SMA sits above both the 150-day and 200-day SMAs, confirming the positive structure across timeframes
- 52-Week Performance: Trading within 2% of its 52-week high of $126.06 while holding a significant 119% premium to its 52-week low of $56.45
- Relative Strength: With a ChartMill Relative Strength reading of 92.86, APH performs better than about 93% of all stocks, showing notable market leadership
These technical traits are essential to the Minervini method because they find stocks that have already moved from basing patterns (Stage 1) into clear uptrends (Stage 2). The uniform alignment across multiple moving average periods points to institutional buying, while the high relative strength shows the stock is receiving a premium valuation for its results.
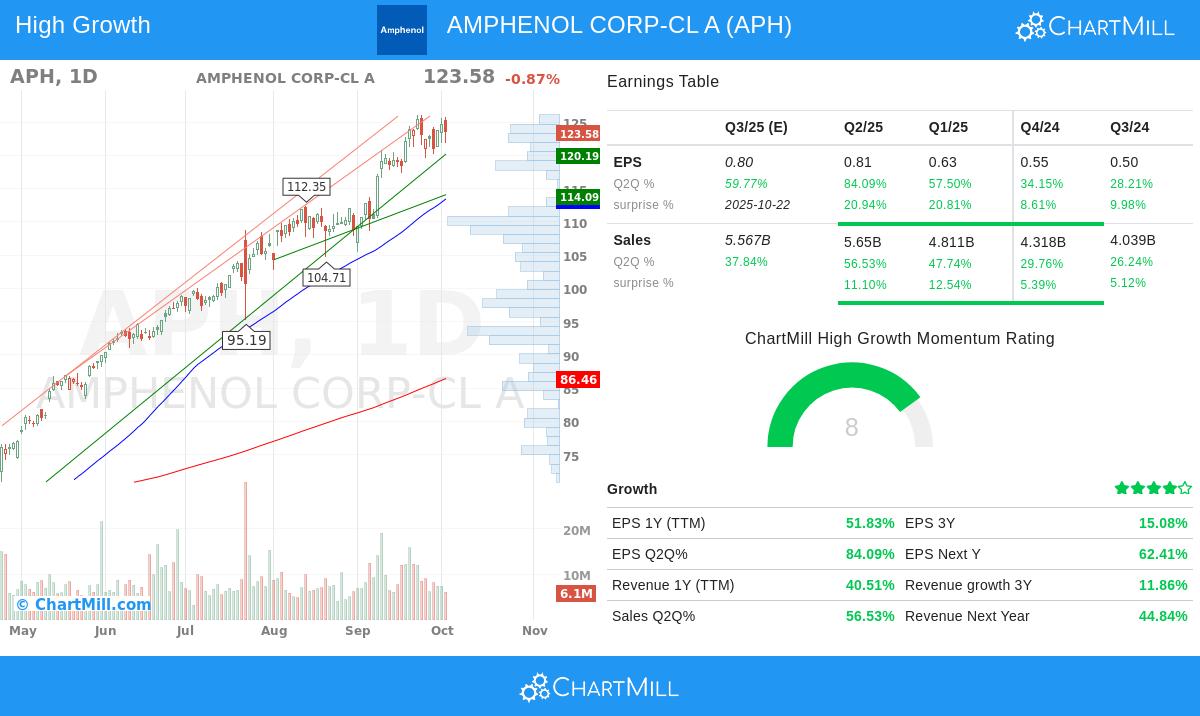
Fundamental Growth Momentum
Beyond technical factors, APH shows the kind of fundamental speed that growth investors look for. The High Growth Momentum rating assesses companies displaying outstanding growth across earnings, revenue, and operational measures.
The company's growth path is notable across several areas:
- Earnings Expansion: TTM EPS of $2.49 shows 52% year-over-year growth, with recent quarterly EPS growth increasing to 84%
- Revenue Momentum: Sales growth has increased significantly, with the latest quarter showing 57% year-over-year growth compared to 26% growth three quarters earlier
- Estimate Revisions: Analysts have raised next-year EPS estimates by 14% over the past three months, showing increasing belief in the company's future
- Consistent Execution: The company has exceeded EPS estimates in all of the last four quarters by an average of 15%, showing a capacity to beat expectations
This fundamental speed is important because Minervini's work indicates that stocks showing strong price moves usually do so at the same time as, or right after, major gains in their basic business fundamentals. The mix of technical strength and fundamental speed creates a strong setup where improving business outcomes draw institutional interest, supporting further price gains.
Profitability and Operational Excellence
While growth measures are important, maintained profitability and growing margins provide the base for lasting outperformance. APH shows notable operational execution beyond simple top-line growth.
The company's profitability profile shows meaningful gains:
- Expanding Margins: Quarterly profit margins have grown from 15.0% three quarters ago to 19.3% in the most recent quarter
- Cash Flow Generation: Free cash flow per share of $2.31 shows 45% year-over-year growth, exceeding earnings growth and indicating good quality earnings
- Consistent Performance: The company has beaten revenue estimates in all of the last four quarters by an average of 8.5%
These profitability measures are significant because Minervini notes that companies with pricing control and operational effectiveness tend to maintain their growth paths longer than those just following industry trends. Growing margins during times of fast growth suggest the company has competitive benefits that let it turn revenue growth effectively into bottom-line outcomes.
Technical Assessment and Market Context
According to ChartMill's technical analysis report, APH receives a perfect 10 out of 10 on their technical rating system, reflecting very good technical health across both short and long-term periods. The report states the stock is currently showing a bull flag pattern, which often gives a possible entry point within a clear uptrend. Support levels are found between $120.19-$120.39, giving a logical zone for initial stop placement, while resistance is in the $123.94-$125.40 range. With both short and long-term trends rated as positive and the stock trading near 52-week highs next to a strong market, the technical setup remains positive.
View the complete technical analysis report for APH for detailed support and resistance levels, volume analysis, and additional pattern observations.
Investment Considerations
For investors using growth and momentum strategies, APH represents a candidate worth more investigation. The stock meets the strict technical standards of the Minervini Trend Template while showing the kind of fundamental speed that usually comes before maintained outperformance. The mix of positive price movement, high relative strength, increasing earnings and revenue growth, growing profit margins, and positive analyst revisions creates a strong profile for growth-focused strategies.
Discover additional high-growth momentum stocks meeting the Trend Template criteria through our predefined screening parameters.
Disclaimer: This analysis is for informational and educational purposes only and does not constitute investment advice. The information presented should not be interpreted as a recommendation to buy, sell, or hold any security. Investors should conduct their own research and consult with a qualified financial advisor before making investment decisions. Past performance is not indicative of future results.