
For investors looking to find companies with both solid momentum and good underlying business growth, a combined method can be especially effective. One useful technique involves combining Mark Minervini’s Trend Template, a strict technical checklist for finding stocks in clear uptrends, with a filter for high fundamental growth momentum. This two-part method tries to locate securities where notable price strength is backed by quickening earnings and sales, a pairing that has in the past driven top market performance. A recent filter using this approach has pointed to Amphenol Corp. Class A (NYSE:APH) as a candidate for more detailed review.
Technical Strength: Following the Minervini Trend Template
Mark Minervini’s method stresses trading in the direction of the main trend, concentrating on stocks that are already strong instead of trying to find lows. The Trend Template gives a fixed group of technical conditions to sort for such stocks. A look at Amphenol’s chart and main metrics shows it fits these requirements, indicating a stock in a strong Stage 2 advance.
- Moving Average Alignment: The stock’s price is trading notably above its important moving averages, with the shorter-term averages lined up above the longer-term ones, a typical sign of a sound uptrend.
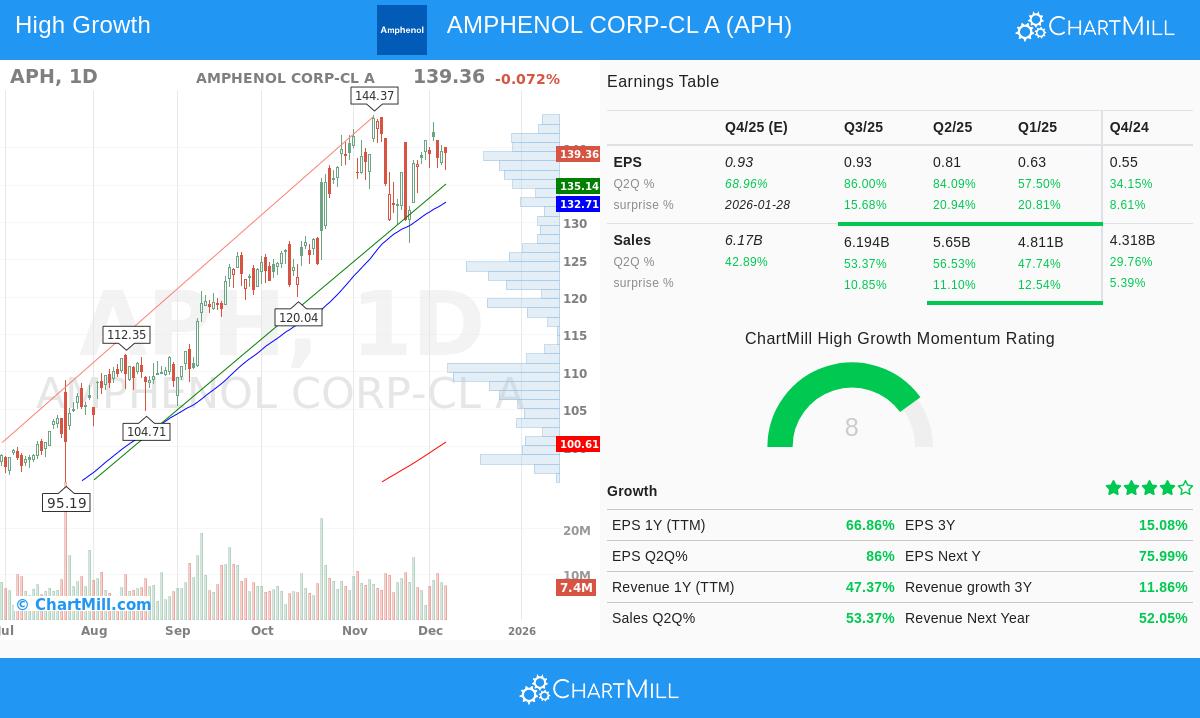
- Current Price ($139.36) > 50-day SMA ($132.71) > 150-day SMA ($111.91) > 200-day SMA ($100.61).
- Importantly, all these moving averages are themselves in upward trends, confirming continued buying pressure across several timeframes.
- Proximity to Highs: Minervini’s rules prefer stocks showing strength by trading close to their highs. APH is currently within 3.5% of its 52-week high of $144.37, and its price is a significant 147% above its 52-week low of $56.45. This shows strong recovery momentum and an absence of overhead supply.
- Superior Relative Strength: A fundamental part of the method is to invest in market leaders. Amphenol’s ChartMill Relative Strength (CRS) score of 94.24 shows it is doing better than 94% of all stocks in the market over the past year. This outstanding relative performance is a key characteristic of leading stocks during bull periods.
This technical view matches a positive short-term and long-term trend for the S&P 500, giving a supportive environment for trend-following methods.
Fundamental Engine: The Argument for High Growth Momentum
While the Trend Template finds how a stock is moving, evaluating why it is moving needs a look at the fundamentals. For a stock to maintain a strong uptrend, it usually requires a catalyst of solid and getting better business performance. Amphenol’s recent financial reports display the signs of high growth momentum that can draw institutional investors and lead to more price gains.
- Strong Earnings Growth: The company is not only growing; its growth rate is increasing sharply.
- Trailing Twelve Months (TTM): EPS has risen 66.9% year-over-year.
- Recent Quarter: The growth is even more clear in the latest period, with EPS up 86.0% compared to the same quarter last year. This increase is an important signal of fundamental momentum.
- Estimate Revisions: Analysts are noticing, having lifted their EPS estimates for the next fiscal year by 8.36% over the last three months. Upward revisions frequently come before further price increases as the market adapts to better expectations.
- Solid Sales Growth: Top-line growth supplies the fuel for earnings, and Amphenol’s revenue path is also notable.
- TTM revenue has increased by 47.4%.
- Sales for the last quarter grew 53.4% year-over-year, showing solid current demand for its interconnect and sensor products.
- Getting Better Profitability: The company is not just selling more; it’s becoming more profitable. The profit margin in the most recent quarter grew to 20.1%, up from 15.9% in the last full fiscal year. This margin growth can greatly increase earnings growth and is a key quality filter for growth investors.
- Steady Execution: The company has surpassed both earnings and revenue estimates in each of the last four quarters, with an average EPS surprise of 16.5%. This record of beating expectations builds trust with the market.
Synthesis: When Technicals and Fundamentals Come Together
The notable aspect of Amphenol as a candidate for this combined method is the connection between its technical position and fundamental performance. The strong uptrend, shown by the stock trading near highs with superior relative strength, is being confirmed by a fundamental story of quickening earnings, rising sales, and growing margins. This is exactly the match that methods like Minervini’s SEPA (Specific Entry Point Analysis) system aim to find: a solid trend backed by a real, improving fundamental catalyst.
Technical Analysis Summary
A look at the detailed ChartMill Technical Report for APH gives the stock a complete technical rating of 10 out of 10, mentioning its steady performance across all time frames. The report states the stock is trading in a wide monthly range and is currently pausing in the middle of that range, which may offer a possible entry point. Key support is found in the $129.55 - $132.71 area, coming from a mix of trendlines and moving averages, with major resistance near the recent high at $143.86.
Find More Possible Candidates
Amphenol Corp. shows one result of a systematic search for stocks that do well on both technical and fundamental growth measures. Investors curious about locating other companies that pass this strict two-part screening can examine the predefined scan directly. Click here to view the current "High Growth Momentum + Trend Template" screen results.
Disclaimer: This article is for informational and educational purposes only. It is not a recommendation to buy or sell any security. The analysis is based on data provided and certain screening methodologies, and it does not constitute investment advice. Investors should conduct their own due diligence, consider their financial situation and risk tolerance, and consult with a qualified financial advisor before making any investment decisions. Past performance is not indicative of future results.