
Should you consider NASDAQ:AMZN for high growth investing?
By Mill Chart
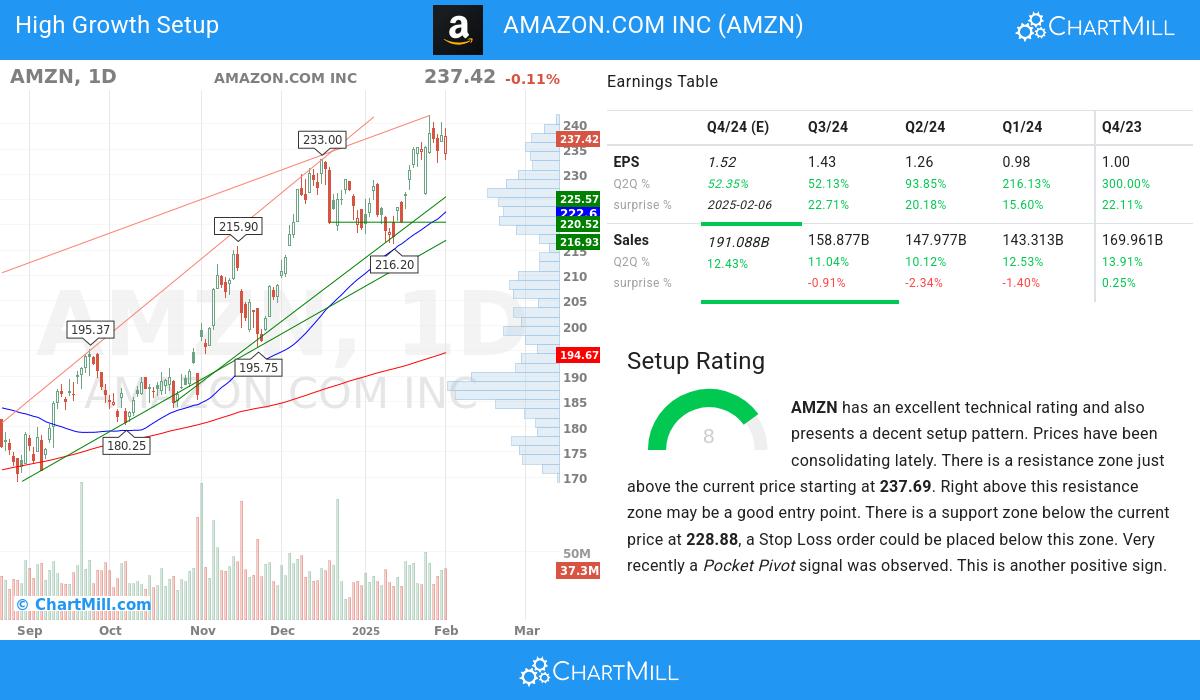
Last update: Feb 4, 2025
AMAZON.COM INC (NASDAQ:AMZN) has been identified as a Technical Breakout Setup Pattern by our stock screener. This pattern typically occurs when a stock takes a pause after a significant rise, indicating the possibility of a continuation in the trend. While it's impossible to predict with certainty, it might be beneficial to monitor NASDAQ:AMZN.
Zooming in on the technicals.
ChartMill assigns a Technical Rating to every stock. This score, ranging from 0 to 10, is updated daily and is determined by evaluating multiple technical indicators and properties.
We assign a technical rating of 10 out of 10 to AMZN. Both in the recent history as in the last year, AMZN has proven to be a steady performer, scoring decent points in every aspect analyzed.
- Both the short term and long term trends are positive. This is a very positive sign.
- When comparing the yearly performance of all stocks, we notice that AMZN is one of the better performing stocks in the market, outperforming 87% of all stocks.
- AMZN is one of the better performing stocks in the Broadline Retail industry, it outperforms 74% of 32 stocks in the same industry.
- AMZN is currently trading near its 52 week high, which is a good sign. The S&P500 Index is trading in the upper part of its 52 week range, but not near new highs, so AMZN is leading the market.
- AMZN is currently showing a bull flag pattern! A bull flag pattern occurs when prices pull back slightly after a strong rise up. This may be a nice opportunity for an entry.
Our latest full technical report of AMZN contains the most current technical analsysis.
How does the Setup look for NASDAQ:AMZN
In addition to the Technical Rating, ChartMill provides a Setup Rating for each stock. This rating, ranging from 0 to 10, assesses the extent of consolidation in the stock based on multiple short-term technical indicators. Currently, NASDAQ:AMZN has a 8 as its setup rating:
AMZN has an excellent technical rating and also presents a decent setup pattern. Prices have been consolidating lately. There is a resistance zone just above the current price starting at 237.69. Right above this resistance zone may be a good entry point. There is a support zone below the current price at 228.88, a Stop Loss order could be placed below this zone. Very recently a Pocket Pivot signal was observed. This is another positive sign.
Some of the high growth metrics of NASDAQ:AMZN highlighted
- The EPS of AMAZON.COM INC has exhibited growth from one quarter to another (Q2Q), with a 52.13% increase. This underscores the company's ability to generate higher earnings and improve its financial standing.
- Analysts' average next Quarter EPS Estimate for AMAZON.COM INC has witnessed a 19.58% change in the last 3 months, underscoring the dynamic nature of market sentiment towards the company's EPS prospects.
- The recent financial report of AMAZON.COM INC demonstrates a 52.13% increase in quarterly earnings compared to the previous quarter. This growth indicates positive momentum in the company's financials and suggests a promising upward trend
- With a favorable trend in its operating margin over the past year, AMAZON.COM INC demonstrates its ability to enhance profitability through efficient operations. This growth reflects the company's focus on optimizing its cost structure.
- With positive growth in its free cash flow (FCF) over the past year, AMAZON.COM INC showcases its ability to generate strong cash flows and maintain a solid financial position. This growth reflects the company's efficient utilization of capital and its commitment to long-term value creation.
- The Return on Equity(ROE) of AMAZON.COM INC is 19.24%, which is a strong number. This indicates the company's ability to generate favorable returns for shareholders and reflects its effective management of resources.
- Maintaining a Debt-to-Equity ratio of 0.28, AMAZON.COM INC demonstrates a conservative financial approach. This signifies the company's focus on minimizing debt burdens while preserving a solid equity position.
- With institutional shareholders at 64.13%, AMAZON.COM INC demonstrates a healthy ownership distribution. This reflects a mix of institutional and individual investors, creating a market environment that may foster increased trading activity and price discovery.
- With a track record of beating EPS estimates in the last 4 quarters, AMAZON.COM INC showcases its consistent ability to deliver earnings surprises. This reflects the company's strong execution and its competitive position in the market.
- AMAZON.COM INC has exhibited strong Relative Strength(RS) in recent periods, with a current 87.47 rating. This indicates the stock's ability to outperform the broader market and reflects its competitive position. AMAZON.COM INC shows promising potential for continued price momentum.
Our High Growth Momentum Breakout screen will find you more ideas suited for high growth momentum breakouts.
Keep in mind
This is not investing advice! The article highlights some of the observations at the time of writing, but you should always make your own analysis and invest based on your own insights.
216.98
+3.41 (+1.6%)
Find more stocks in the Stock Screener
AMZN Latest News and Analysis
 3 days ago - ChartmillThese S&P500 stocks are the most active in today's session
Looking for the most active S&P500 stocks in today's session? Join us as we dive into the US markets on Friday and discover the stocks that are dominating the trading activity and setting the pace for the market.
4 days ago - ChartmillThese S&P500 stocks are the most active in today's sessionExplore the S&P500 index on Thursday and find out which stocks are the most active in today's session. Stay updated with the stocks that are capturing market interest.
 6 days ago - ChartmillAMAZON.COM INC (NASDAQ:AMZN) - A Technical Breakout Candidate Worth Watching
AMAZON.COM INC (NASDAQ:AMZN) shows strong technicals and a high-quality setup, making it a potential breakout candidate for traders. The stock's bull flag pattern and clear support/resistance levels add to its appeal.
 12 days ago - ChartmillMarket Monitor News May 29 (Abercrombie & Fitch, Box UP - Okta, Trump Media DOWN)
Wall Street Slips as Investors Brace for Nvidia Earnings and Economic Uncertainty
13 days ago - ChartmillStay informed about the most active stocks in the S&P500 index on Tuesday's session.Curious about the most active S&P500 stocks in today's session? Get insights into the stocks that are leading the way in terms of trading volume and market attention.
17 days ago - ChartmillFriday's session: most active stock in the S&P500 indexLooking for the most active S&P500 stocks in today's session? Join us as we dive into the US markets on Friday and discover the stocks that are dominating the trading activity and setting the pace for the market.
 18 days ago - ChartmillMarket Monitor News May 23 (Snowflake, Urban Outfitters UP - SolarEdge Technologies, Sunrun DOWN)
Wall Street Calms After Budget Jitters – Green Energy Tumbles, Alphabet Shines
 20 days ago - ChartmillAMAZON.COM INC (NASDAQ:AMZN) - A Strong Growth Stock with a Technical Breakout Pattern
AMAZON.COM INC (NASDAQ:AMZN) shows strong earnings growth and a bullish technical setup, making it a potential candidate for growth investors.
