
TRADERS - Chartmill Bull and Bear Indicator (Part 2)
Published on Chartmill with kind permission of TRADERS’ Magazine. Check the original PDF article here
Divergency isn’t by long a new focal point of technical analysts anymore. The deviating behavior between different aspects, indicators if you will, in a certain analysis can point the way to trend changes being imminent. As always the biggest problem in technical analysis, which is all about measuring probabilities rather than forecasting a certain future, is the quantification of concepts like this. Most attempts get stuck in an algorithmic approach trying to capture certain graphical setups, resulting in mediocre results at best. This article series will try to provide a statistical framework, which resulted in a particular indicator.
In the previous and first article of this series we talked about measuring intrinsic divergence, i.e. divergence within one time series as opposed to the far more popular divergence between different time series. Such intrinsic divergence will be invisible on a normal price chart. Divergence between different time series, let’s call it extrinsic divergence, will be visible, but consequentially might have lag. What’s more, extrinsic divergence is pretty hard to detect algorithmically.
Also in the previous article we showed the tendency of high percentage days to close near one of its extremes (high or low). High percentage up days tend to close near the high while high percentage down days tend to close near the low. Both with a high statistical correlation. This is exactly what we can use to build an intrinsic divergence indicator. As we’ll see, the Chartmill Bull indicator (CBI) tries to find deviations from that pattern. Those situations where an extreme down day is accompanied with a relative strong but abnormal close near the high. Of course this should be a tendency over several days, not a single isolated day. Likewise the Chartmill Bear Indicator will spot divergences between closing strong but with an inner tendency to close near the low. Let’s get at it and start by focussing solely on bullish signals.
Bullish divergence
Measuring bullish divergence can be done by looking at how weak a close is in a daily timeframe while looking at the tendency to close near the high on an intraday level. We can determine strength by comparing the close or relative close location to nearby, i.e. recent, closes or relative close locations. Let’s take this one step at the time.
Doing so, we can look for a close that’s relatively low, compared to the last twenty closes and a relative close that’s high compared to the last twenty relative closes to the high. Naturally inclined to come up with averages or differences as one might be, we’re going to opt for percentiles, this time.
Percentiles
In statistics, a percentile is the value below which a certain percentage of all observations fall. For example, the 35th percentile would be the value below which we find 35% of all values measured. The 25th percentile is also called the first quartile, the 50th percentile is the second quartile (or even more popular: the median) and the 75th percentile is hence called the third quartile.
Using percentiles has several advantages over averages. First an outlier doesn’t have a large impact on percentiles (as it is larger or smaller than the percentile, but it doesn’t matter how large/small). Think about the following example. The values 1 2 3 4 5 have a median as well as an average of 3. Replacing 5 by 50, doesn’t change the median but inflates the average to 12 (a factor of 4). Secondly, large values will have a large effect on averages when entering the computation window (e.g. the last 20 days), and once again when disappearing from that same window. Since percentiles don’t get impacted by this, neither adding nor deleting extremely large or small values will make percentiles jump up or down.
So what the Chartmill Bull Indicator does is look for days where the close is among the 25% lowest closes of the past twenty days, while at the same time looking for a relative close near the high being among the 25% highest intraday closes over the past twenty days.
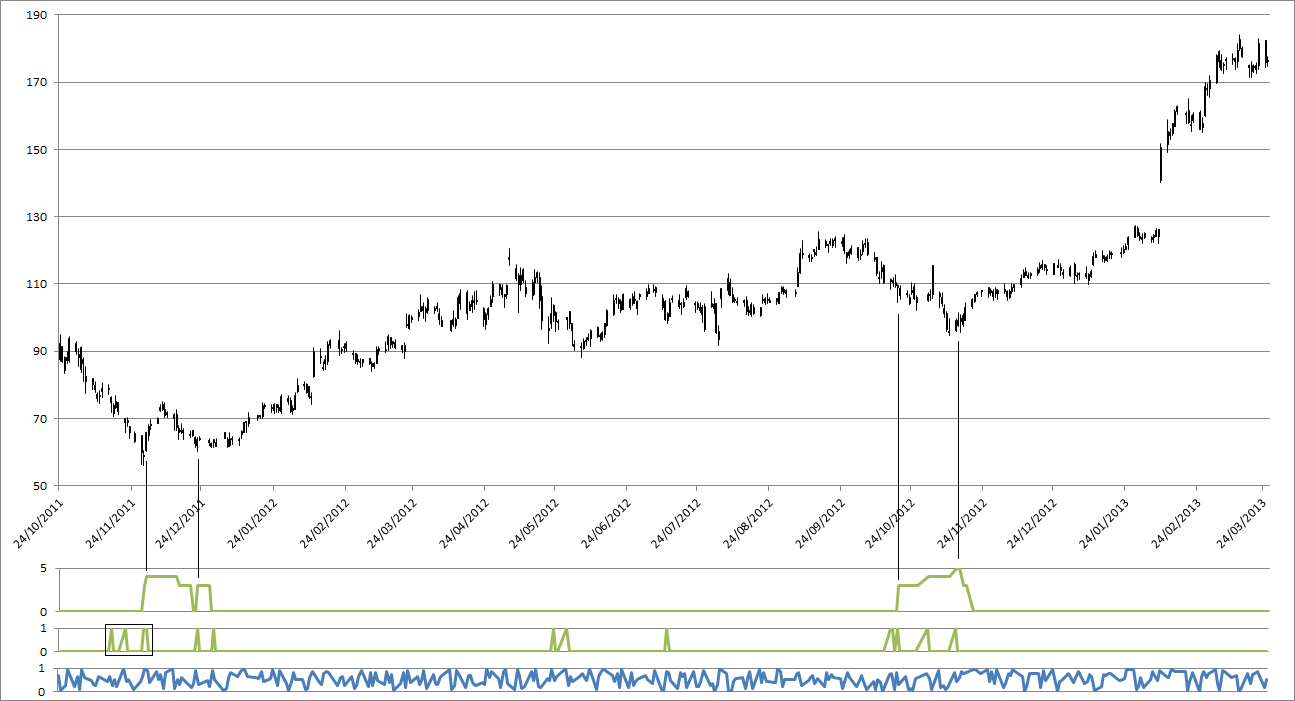
Look at figure 1, second lowest indicator, showing spikes for such days. We rectangled the first four of them appearing on the chart. On each occasion, such a spike shows a day being amongst the 25 per cent worst days of the past 20 days in terms of absolute close, while at the same time being one of the 25 per cent strongest closes relatively near the high over the same 20 days window.
As such, these spikes show extreme divergence, since they break with the strong correlation we proved in the previous article between extreme days and extreme closes.
Figure 1 thus gives us the green spikes, showing very weak days with relative strong closes (near the high). Because the CBI doesn’t look at the absolute value of any close or relative close position, it is totally adaptive. In some cases closing in the upper 60% of a daily range might be enough to distinguish itself from a lot of the previous 20 days, giving a divergence signal, while in other cases, closing in the top 5% of the range might not even be enough, because the previous 19 days all closed in the top 3% of their range. So adaptability is key here.
Tendency
As a reminder, normally, very weak days (with large drops in price) statistically tend to have also very weak closes (near the low of the day). That way, the event whereby a very weak day closes strong is quite a deviation from the norm. In a non-statistical context traders already developed a feel for this by defining and focussing on patterns like key reversal days. So in a sense the CBI is merely a statistically, algorithmically, objective and adaptable way of incorporating things like key reversal days.
Looking at isolated days of weak days with strong closes, relative to the past 19 days, is of course just that: isolated events. It is far more interesting if such spikes, all of a sudden, start to cluster. This can be measured very easily by applying a running sum to the spikes. This is seen on the upper green indicator of figure 1 and, not surprisingly a main component of the Chartmill Bull Indicator. One more thing the CBI does is clip off this running count of divergence days. Only when a minimum of 3 spikes (or more) were seen in the past twenty days, will the indicator show the number of spikes. This can be seen in another way as having the horizontal x-axis levelled up from 0 to 2 on the y-axis. As engineers would state it: the indicator is clipped off at a threshold 2. That way only 1 or 2 divergence days in the twenty day look back period are considered noise that we don’t want to see. We want a sufficient number of divergence days in the past 20 days before they show up on the indicator.
How about it
Well then. Is this indicator any good. Three things can be done to answer this question. We can look at some examples. We are going to do this right away. Secondly, a more rigorous back test can be done, which we’ll leave for the last article in this series. Finally, and also left for the final article, we could look at further enhancing or estimating the quality of signals in a broader context, as deduced from the indicator’s definition.
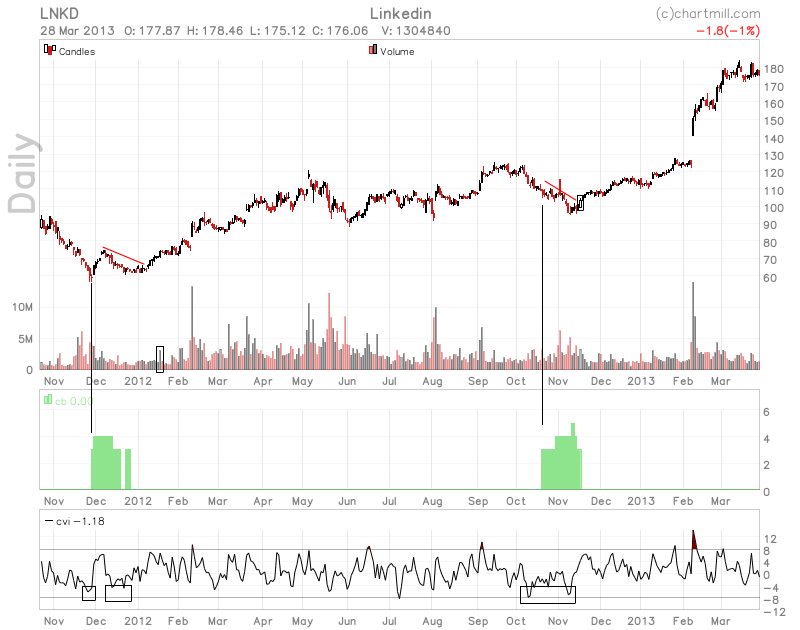
For this article we stick to an evaluation of the example scenario. Take a look at figure 2, which shows the same LNKD scenario as figure 1, but with the final implementation of the Chartmill Bull Indicator.
At first glance it seems as if the Chartmill Bull Indicator gave us two very nice scenario’s which, combined with a trailing stop loss, resulted in two trades with efficiencies, i.e. which part of the move they caught, of 55% and 71%. In the overall range of the chart both trades managed to get up to 77% out of it, while limiting the exposure to only 68% of the total timeframe presented in the chart.
In its own way this is already quite an achievement. But, when we take a closer look there’s even more to see. The most important takeaway from this example, is that the signals are given quite timely, perhaps even too early so (particularly in the second case). This seems to be a general characteristic of the thing we’ve built here (again, more on that in the next article). In effect, it is obvious from the chart that signals clearly start to develop before any extrinsic divergence can be spotted. For an extrinsic divergence to be in place, typically a higher low would have to be awaited. Signals being too early are not that much of a problem as a breakout can be anticipated by a buy stop trailing down, as depicted by the descending trend lines on the chart in figure 2. As always, entry is just a minor part of the whole trading profession. Trade management, i.e. scaling in and exiting, eventually will, to a much larger extent, dictate if one is overall profitable or not.
Disclaimer
The example was of course handpicked to show some clear-cut ideas here. So definitely do not expect all signals to be of this quality. But as stated, we’ll get into this in the final article.
There’s some statistical prepping and more that makes the difference between figure 1 and figure 2, but those details are not that important at this point, as they would mainly just clutter the essence of the indicator as explained in this article.
There’s also a Chartmill Bear Indicator which is the symmetrical counterpart of the Chartmill Bull Indicator. Both are available on Chartmill. The scanner over there also allows for selecting stocks based on these indicators.
References: High Probability Trading by Marcel Link and Long/Short Market Dynamics by Clive M. Corcoran.
[FIGURE 1]
[HEAD] Intrinsic divergence
[CAPTION] Figure 1: This chart of LinkedIn shows the relative close of each day at the bottom (blue line, zero being a close at the low, one being a close at the high). The green indicators represent the divergence days (very weak days with strong closes) and their accumulation (on the top green indicator).
[FIGURE 2]
[HEAD] Intrinsic divergence as shown by the Chartmill Bull indicator
[CAPTION] Figuur 2: Chartmill version of the chart in figure 1, showing the Chartmill Bull Indicator as a possible leading indicator to trend changes.
DIRK VANDYCKE is actively and independently studying the markets since 1995 with a focus on technical analysis, market dynamics and behavioral finance. He writes articles on a regular basis and develops software partly available at his co-owned website www.chartmill.com. Holding master degrees in both Electronics Engineering and Computer Science, he teaches software development and statistics at a Belgian University. He’s also an avid reader of anything he can get his hands on. He can be reached at dirk@monest.net