
Stock Market Corrections Aren’t Time to Panic - They’re Time to Prepare!
When the market takes a hit, fear and uncertainty dominate the headlines.
Many traders rush to the sidelines, worried about further losses. But smart investors know that stock market pullbacks aren’t a time to panic - they’re a time to prepare.
A market correction can feel uncomfortable, but history shows that these downturns often create some of the best buying opportunities. Instead of reacting emotionally, use this time wisely by building a watchlist of high-quality stocks that are trading at attractive levels.
When the dust settles, you'll be ready to act with confidence.
In this article, we’ll walk you through how to identify strong stocks during a market pullback, key factors to consider, and how to use tools like ChartMill to make your watchlist more effective.
But first, what is considered a market correction?
A stock market correction is typically defined as a decline of 10% to 20% from a recent peak in a major stock market index (e.g., S&P 500, Nasdaq, Dow Jones Industrial Average).
These are a normal part of market cycles and often occur after extended periods of rising stock prices.
A stock market pullback of less than 10% is generally considered a minor dip, while a drop of more than 20% signals a bear market.
These corrections usually last from a few weeks to a few months but rarely extend for long periods and they are triggered by various factors:
- Economic data (weak earnings, slowing growth, interest rate hikes)
- Geopolitical tensions or macroeconomic concerns
- Market overvaluation (profit-taking after a long rally)
- Unexpected events (pandemics, banking crises, President Trump's tariffs, etc.)
Focus on Quality
Yes, this could be a great time to start building a watchlist of quality companies that have seen declines in the past few weeks.
A market downturn often presents opportunities to pick up strong stocks at discounted prices, but the key is to target companies with solid fundamentals first and then focus on technical setups within that group that can signal potential upturns.
How to Build Your Watchlist?
First, focus on fundamentals, screen for companies with:
- Strong revenue and earnings growth
- Healthy balance sheets (low/reasonable debt, strong cash flow)
- Competitive advantages/moats
- High return on Capital Employed (ROCE) and return on invested capital (ROIC)
Suggested screen: Finding Quality Compounders with Compounding Quality

A ChartMill Trading Idea as described by Compounding Quality, a former professional investor. The screen focuses on quality stocks with low capital intensity and generating increasingly large free cash flows.
A detailed description and discussion of the screen can be found in this article.
First 5 results (sorted by market cap) of this screen in ChartMill (at the time we wrote this article):

Direct link to the full US list (updated to most recent date)
Second, check the technical conditions, stocks in a downturn often go through stages:
Oversold but not ready
You can use technical indicators like the RSI or Stochastics to gauge this. Both should show (very) low levels, indicating that the stock is deeply oversold, however, there are no signs of reversal at this stage.
Check out Arista Networks, one of the companies from the Compounding Quality screen (see above).
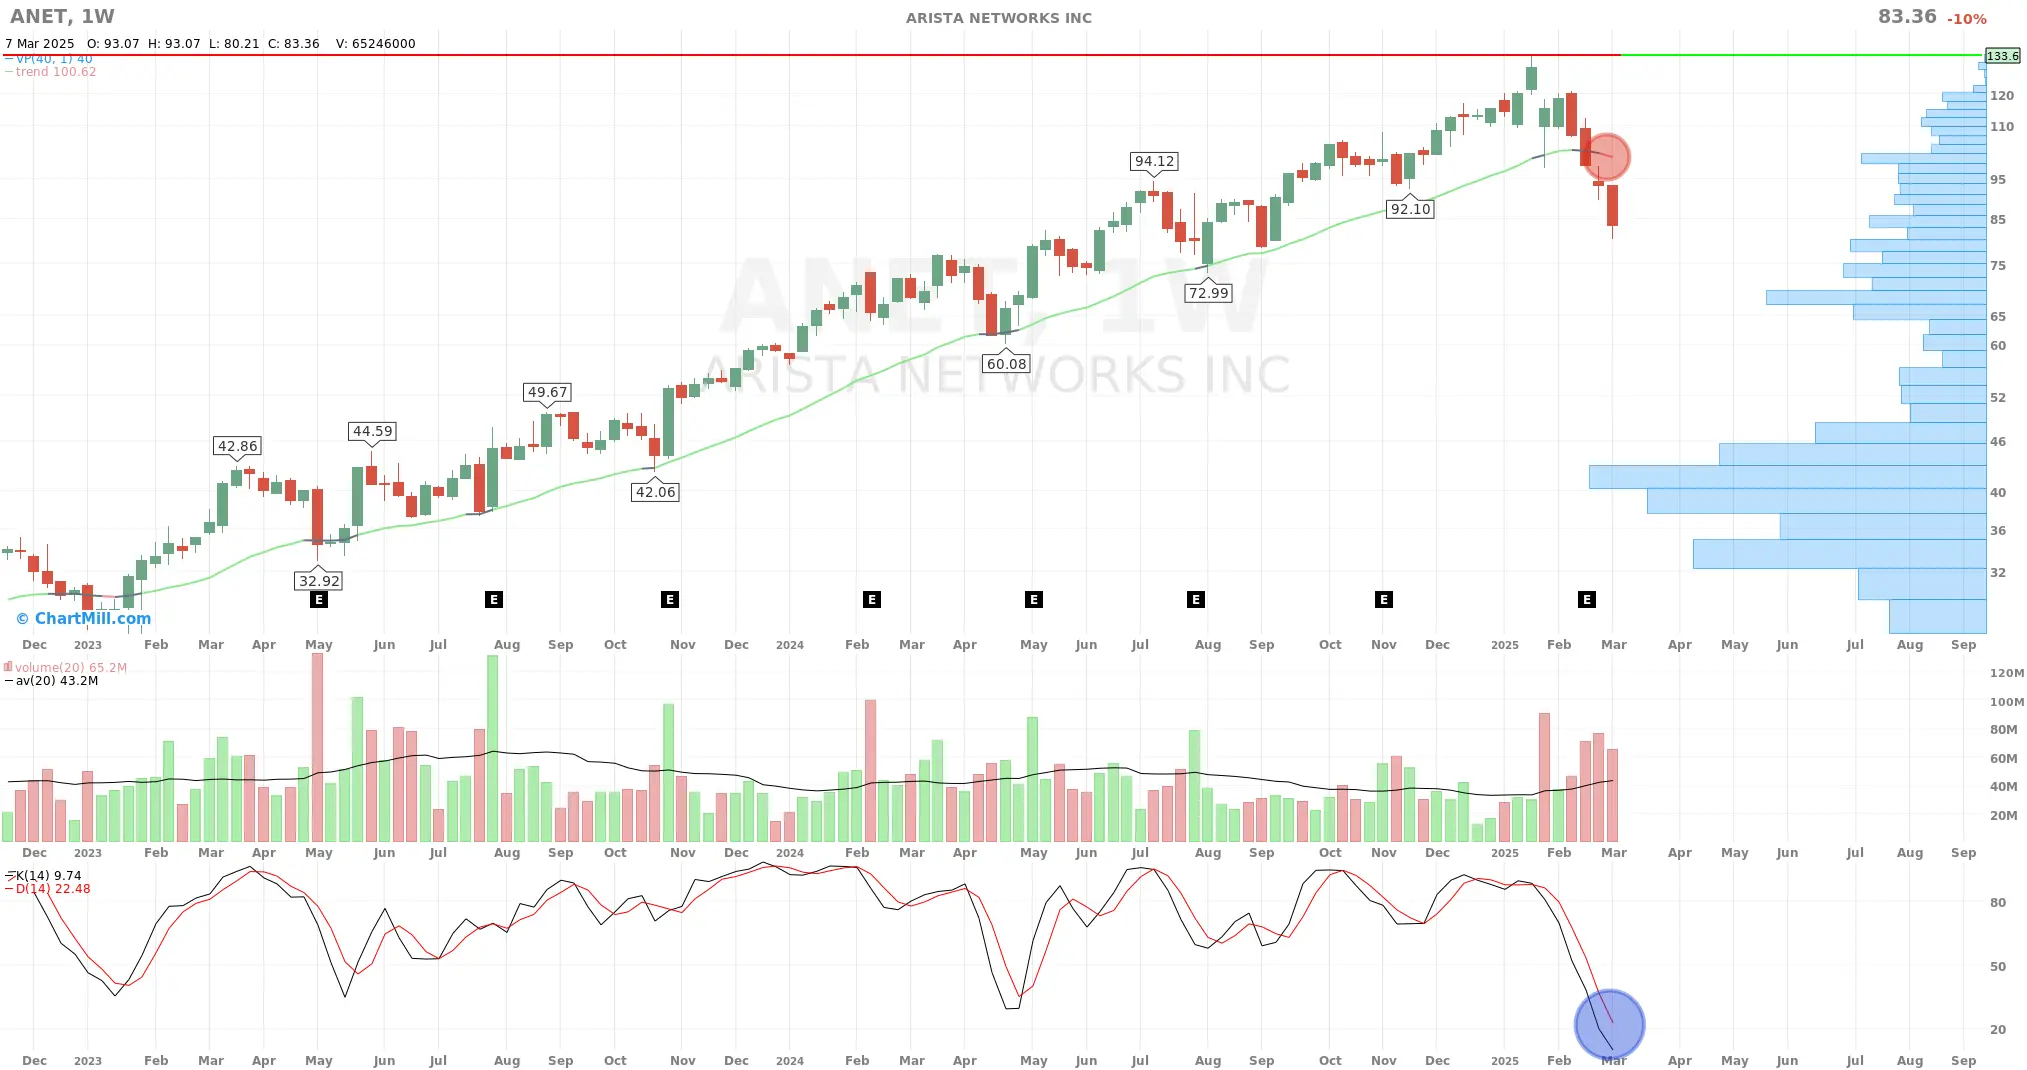
This is a weekly chart of Arista Networks (ANET). The stock has been in a strong long-term uptrend but is currently experiencing a sharp correction, breaking below our ChartMil Trend Indicator (turned red after friday’s close).
Increased selling volume suggests strong downside pressure.
The Stochastics indicator is deeply oversold, indicating a possible near-term bounce, but confirmation is needed, never try to catch a falling knife!
Direct link to this 'Quality Compounding list' for which the Stochastics Indicator is below 20.
Bottoming out
This is where it starts to get interesting... When the sequence of lower tops and bottoms stalls, the volume with which the decline is taking place dries up, and you notice the first signs of buyer interest (usually at potential price support levels).
Reversal signs
It isn’t always easy to pinpoint the moment that a stock is showing clear reversal signals. Watch out for higher lows, increasing volume, combined with breakouts above key moving averages or key resistance areas.
One stock that is currently catching our attention is Inmode LTD (INMD), also a Quality Compounding result from the selection above.
The stock has recently bottomed out and a possible price breakout would be confirmation of a potential trend reversal.
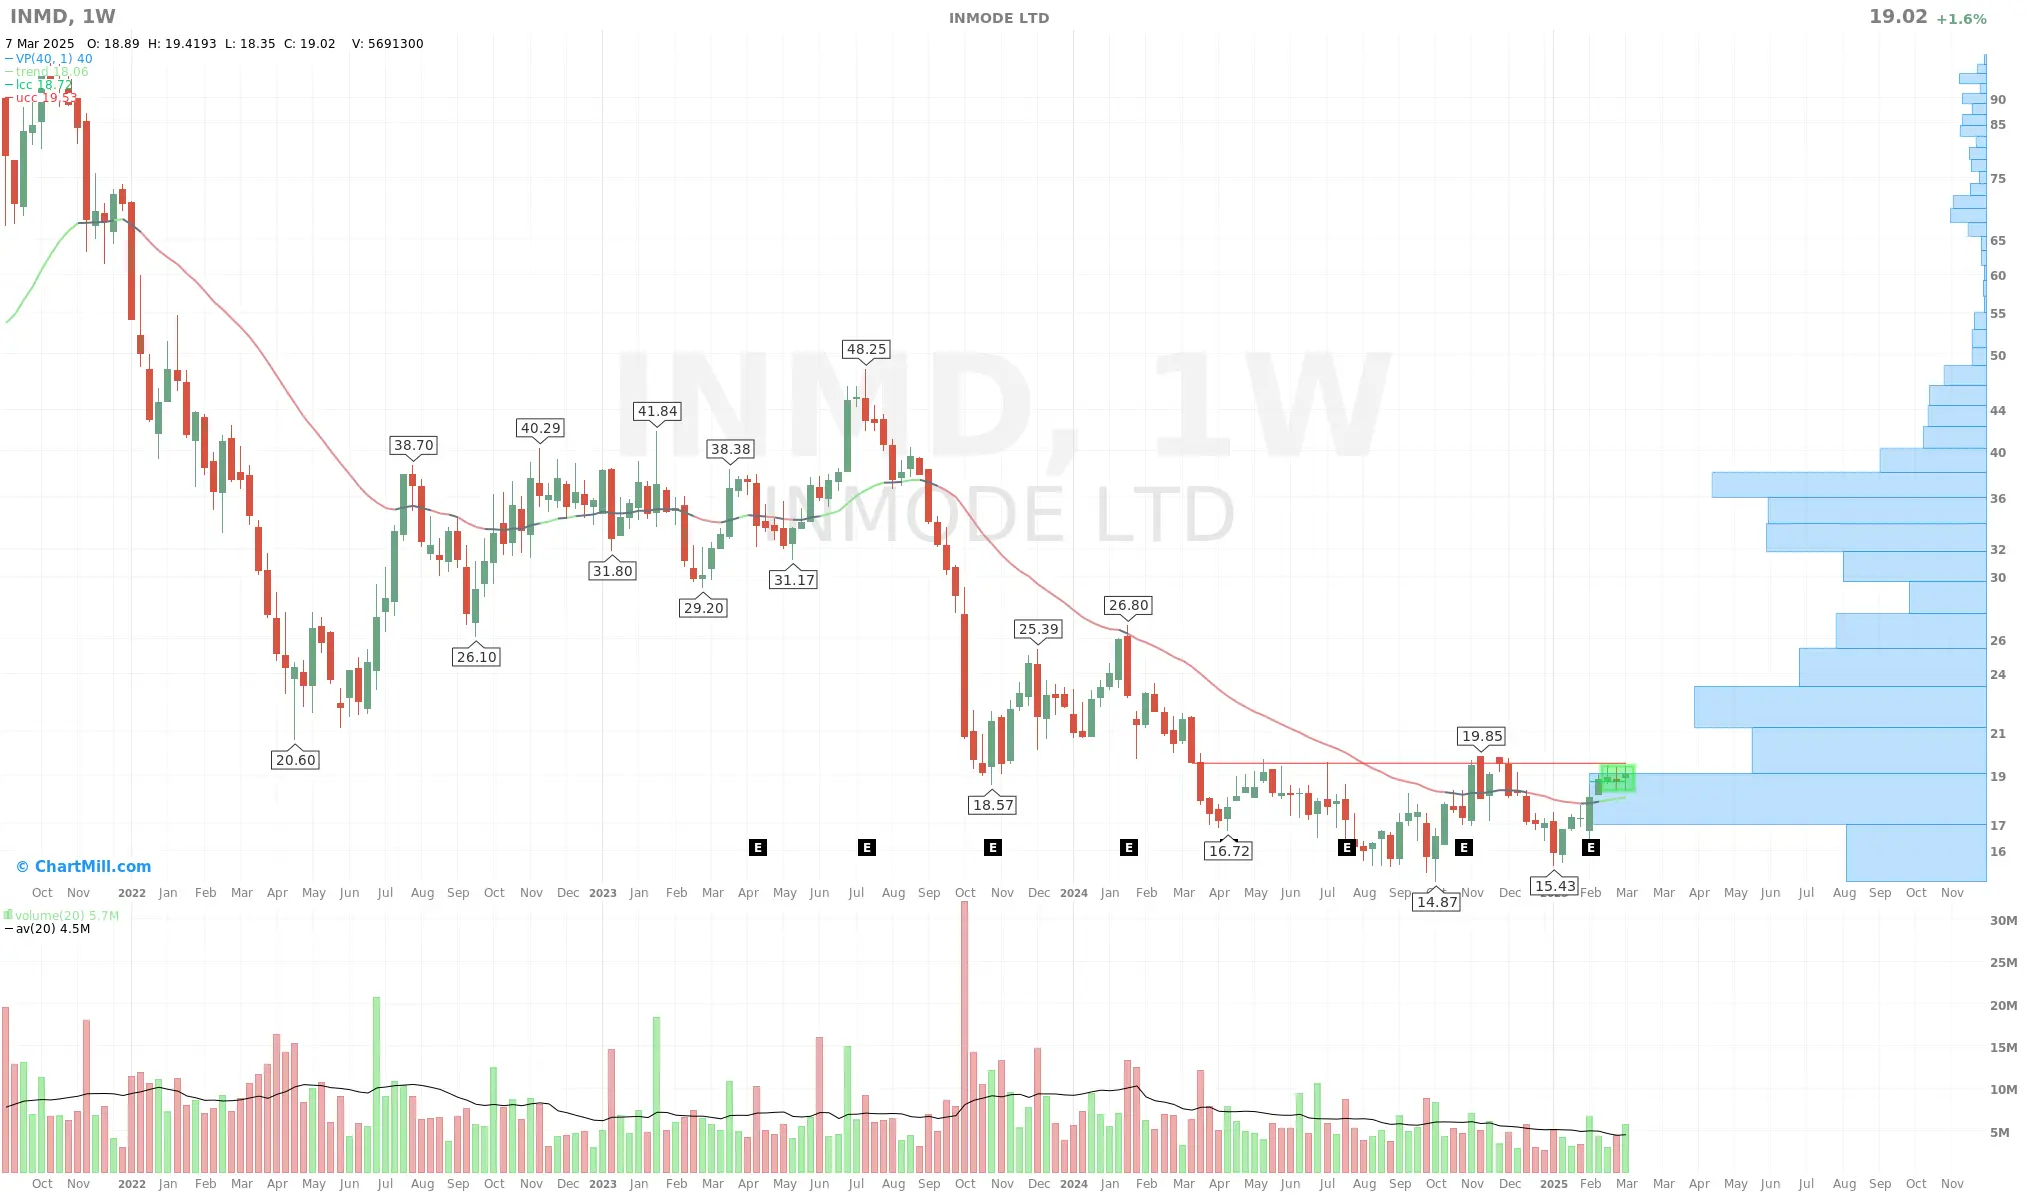
This stock is down more than 57% since the high of July 24, 2023. The lowest price was reached on September 03, 2024 ($15.68 | -65%).
Since the end of May 2024 the price has been consolidating between $15 and $19.80 and in the last three weeks the range in which the stock moves has become extremely narrow while volume is picking up.
Moreover, the ChartMill Trend Indicator has also changed to Bullish since about three weeks.
These kinds of conditions - where the stock seems ready for a price breakout - are of interest to short-term investors, swing traders as well as long-term investors.
Why?
For those using a short(er) term strategy, this setup is attractive because it allows for a clear stoploss with a good risk/reward outcome.
For long-term investors who buy Inmode because of its intrinsic fundamentals qualities, a possible price breakout is also interesting to take an initial position.
Technical analysis may not be important to fundamental orientated investors (or at least subordinate in their strategy), but the fact that this price level can also trigger technical traders is definitely a nice bonus.
The most important thing to keep in mind is that - no matter how favorable the conditions may seem - there is nothing guaranteeing that after any price breakout, the stock will not fall back again and resume its downtrend.
How you respond to this as a short-term trader or long-term investor depends largely on the strategy you use.
Appropriate risk management and position sizing are crucial here. Interested in reading more about those subjects? Start here!
What This Means for You
Market pullbacks can be unsettling, but they also present opportunities for those who are prepared. Instead of reacting emotionally to short-term volatility, use these periods to refine your strategy, build a high-quality watchlist, and look for signs of potential reversals.
Regardless of whether you are a short-term trader looking for technical setups or a long-term investor focused on fundamental values, if you have a plan, you are ahead of the crowd.
With the right mindset and the right tools - like ChartMill - you can turn market corrections into opportunities rather than setbacks.
Stay patient, stay disciplined, and be ready to act when the time is right!
FAQ
On average, how long does it take for markets to recover from a downturn?
The time it takes for markets to recover from downturns varies significantly, depending on the severity and underlying causes of the decline.
Here's an overview based on historical data:
Corrections: These are declines between 10% and 20%. They are generally shorter in duration, often lasting a few months, with recovery times varying based on specific circumstances.
Most recent correction in the SPY (-10.12%) dates from July 24 to Oct. 23, 2023.
Crashes: A sudden and drastic downturn across a major cross-section of a stock market is called a crash (+10% to 30% or even more...).
Most recent crash in the SPY (-32.23%) dates from February 10 to March 16, 2020
Bear Markets: These are typically defined as downturn trends of 20% or more from recent highs. Historically, from 1926 to 2014, the average duration of a bear market was approximately 13 months, with an average cumulative loss of 30%. The recovery period - time taken to return to previous peak levels - varied but often spanned several years.
Most recent bear market in the SPY (-24.8%) dates from December 27, 2021 to September 26, 2022