
How To Use the Money Flow Index?
Introduction
The Moneyflow Index is a typical momentum indicator that indicates the extent to which there is inflow or outflow of market capital. In this way the underlying money flows are visualized. Both price and volume are cumulatively processed in the formula of this indicator.
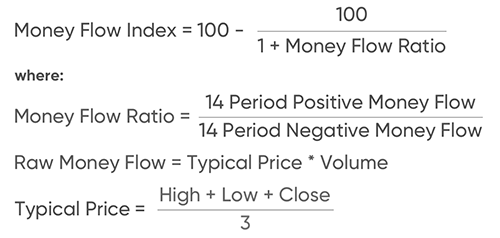
Calculating the Money Flow Index
The calculation is done by multiplying the volume by the average price. The average price is obtained by adding the highest, lowest and closing price and then dividing the result by 3. If the price rises then there is incoming capital. In the opposite case, if the price is falling, there is money being withdrawn. In this way the pure positive and negative Money Flow values are obtained. In order to subsequently calculate the Money Flow ratio, the 14-day positive Money Flow is divided by the 14-day negative Money Flow.
After this, the obtained value is converted so that the indicator can be displayed as an oscillator with values between 0 and 100.
Interpretation of the Money Flow Index
The indicator can be used in several ways.
To identify the end of a price decline in a long-term rising trend
Stocks that exhibit a long-term rising trend and experience a price decline in the interim offer great opportunities for trend investors. The question is of course how to recognize the end of such a price retracement early. This indicator can be a good tool for that purpose.
Below the weekly chart of Rambus Inc (NASDAQ: RMBS) with at the bottom the Money Flow Index.
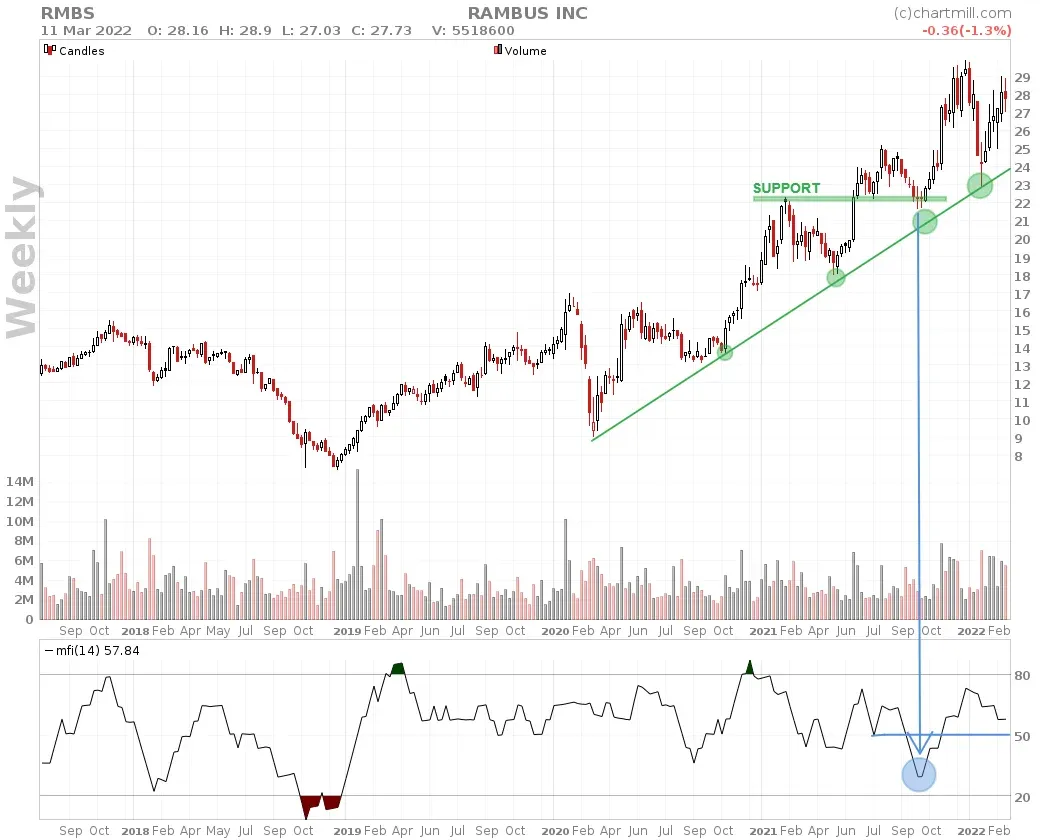
After the price rose above the former top of $17 in late 2020, the upward trend became clear with a succession of higher tops and bottoms. In early October 2021 the price fell back to $22, the level at which the previous swing high was located (mid-February 2021), which may be support for the long-term trend. At the same time, the price came in the immediate vicinity of the rising green trend line. The assumption that buyers would re-enter the market at this price level was reinforced by the Money Flow Index oscillator falling to +/- 30, an indication that the market was getting oversold. By the end of 2021, less than 2 months later, the price was already trading 30% higher.
To identify a trend change using divergence between the indicator and the price.
Divergence signals are typical for oscillators and thus also for this Money Flow Index.
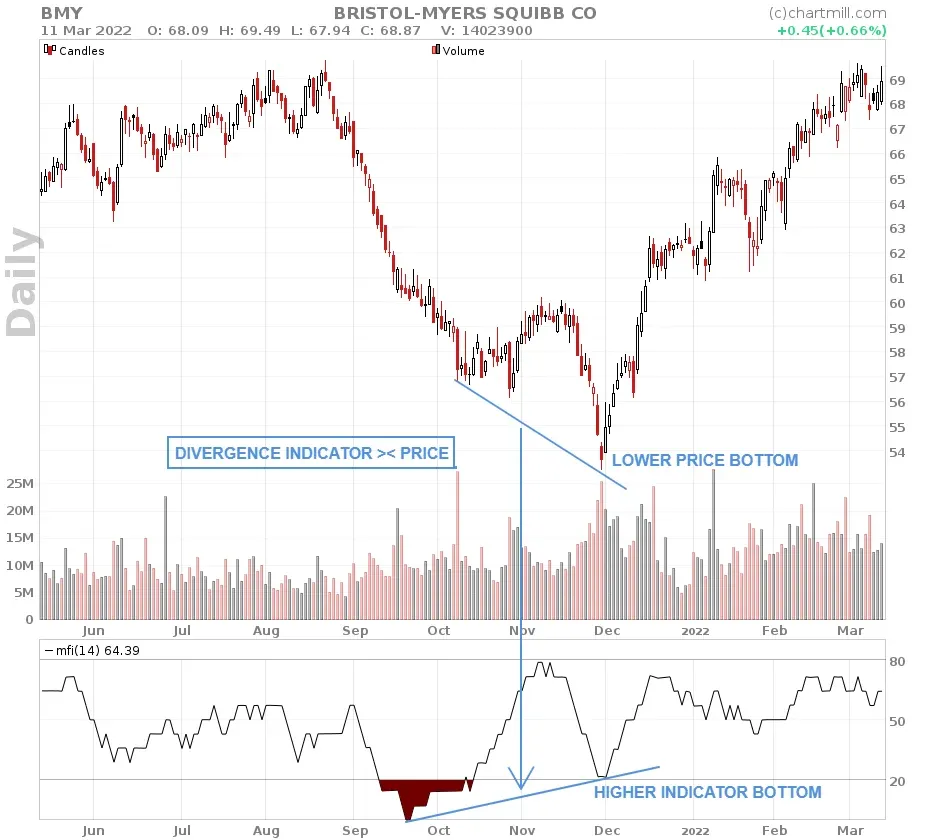
Such divergence signals indicate that the indicator is moving in an opposite direction to price, as seen above on the Bristol-Myers chart (NYSE:BMY). From mid-November to the end of November 2021, the price declines aggressively with high volume and momentum and a new lower price bottom is formed compared to the low in late October. At the same time, the Money Flow Index is also falling but less violently. The indicator makes a higher bottom. This is the beginning of a true trend reversal from early December with a price rally from $54 to +/- $70 in just 3.5 months.
In conclusion.
Be cautious of false signals, especially if you are going to use it to spot reversal signals in stocks that show a very strong trend. The indicator is much more reliable if you use it to confirm price retracements which offer good opportunities to take positions in the direction of the already existing long-term trend. In doing so, never rely solely on the signal of the indicator but combine it with other elements on the chart which support your hypothesis and determine the size of your position in function of your desired risk and available trading capital.