Understanding the On Balance Volume indicator (OBV)
WHAT IS THE ON BALANCE VOLUME INDICATOR (OBV)?
The OBV indicator is a momentum indicator. It plots volume against price changes. The OBV indicator can rise, fall or stay the same. This depends on how the price evolves:
- If the stock price rises then the volume of that period will be added to the previous period. This causes the OBV-indicator to rise.
- If the stock price decreases then the volume will be subtracted from the previous period. The OBV indicator will thus decrease.
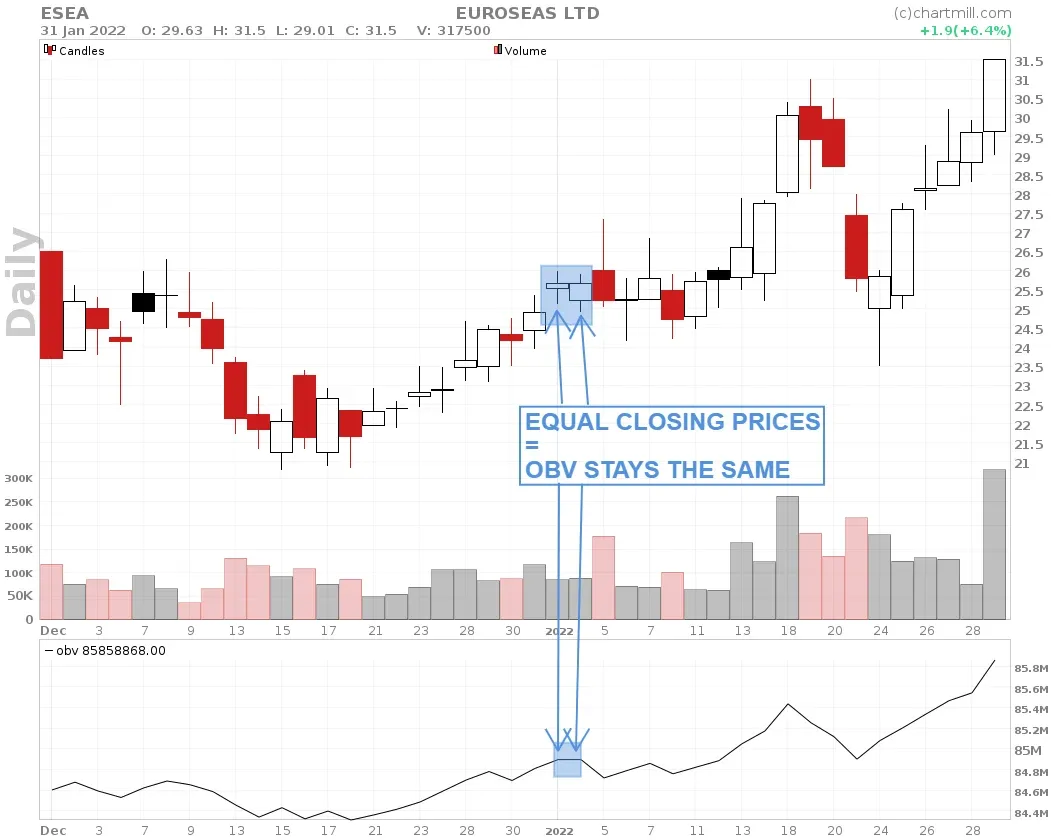
- When the closing price of the last period is exactly equal to the closing price of the previous period, the OBV indicator will remain unchanged. After all, there is no change in the share price, which is one of the necessary conditions for the OBV indicator to change.
WHAT IS THE OBV INDICATOR USED FOR?
The importance of volume
Volume is a very important indicator in active investing because it reflects the strength behind a specific price movement. A clear breakout supported by strongly increased volume is a much stronger signal than the same breakout with only little volume (which increases the chance of a false breakout).
On the other hand, low volume in a price drop in a general rising trend is seen as positive. This is important, for example, in a retracement strategy whereby interim price dips with low volume in a rising trend are seen as buying opportunities.
The advantage of the OBV indicator is that it visualizes the volume streams on the chart. This allows you to better valorize the value of a price movement because in addition to the mere price increase, it also takes into account the volume that went with it.
HOW TO USE THE OBV INDICATOR?
Markets rise, fall or move sideways. For each scenario, the OBV indicator can give valuable information by visible divergences between the price and the OBV indicator. Keep in mind that the actual values of the OBV indicator are of no importance, it is mainly the trend of the indicator that is interesting, especially when it deviates from how the price moves...
Divergences
Upward Price Movement
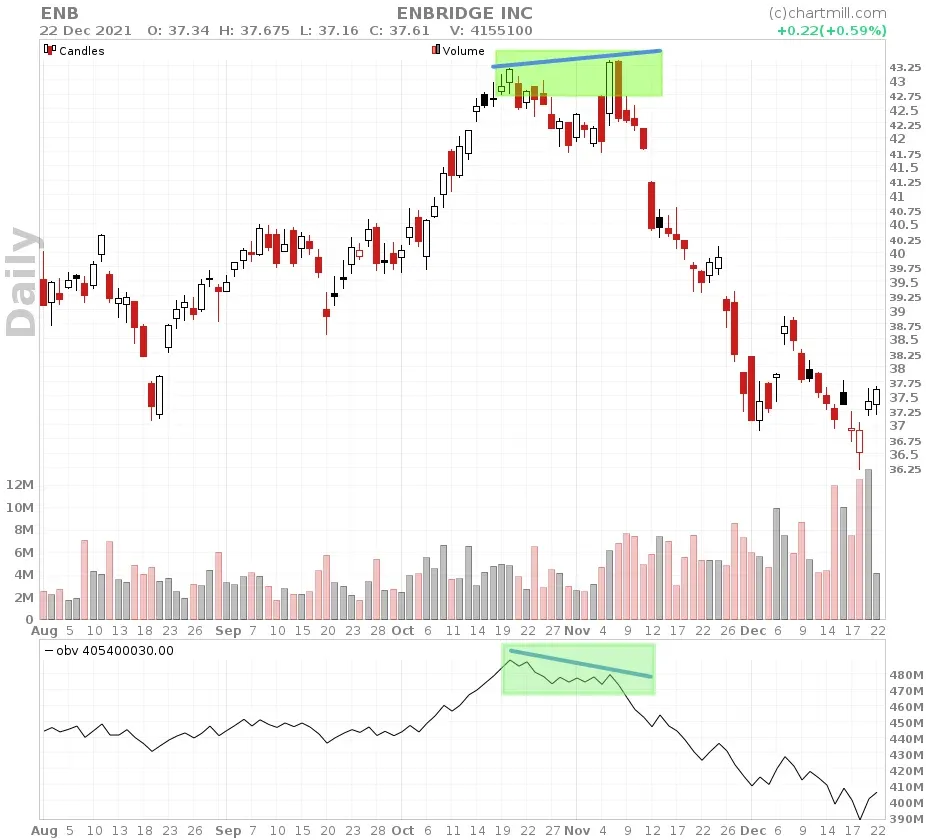
The Enbridge stock rises to a new high at the beginning of November 2021, in contrast to the OBV indicator which shows a lower top (=divergence) and thus gives a warning that the last price breakout was supported by much less volume. In mid-December - barely a month and a half later - the price was trading more than 15% lower.
Downward Price Movement
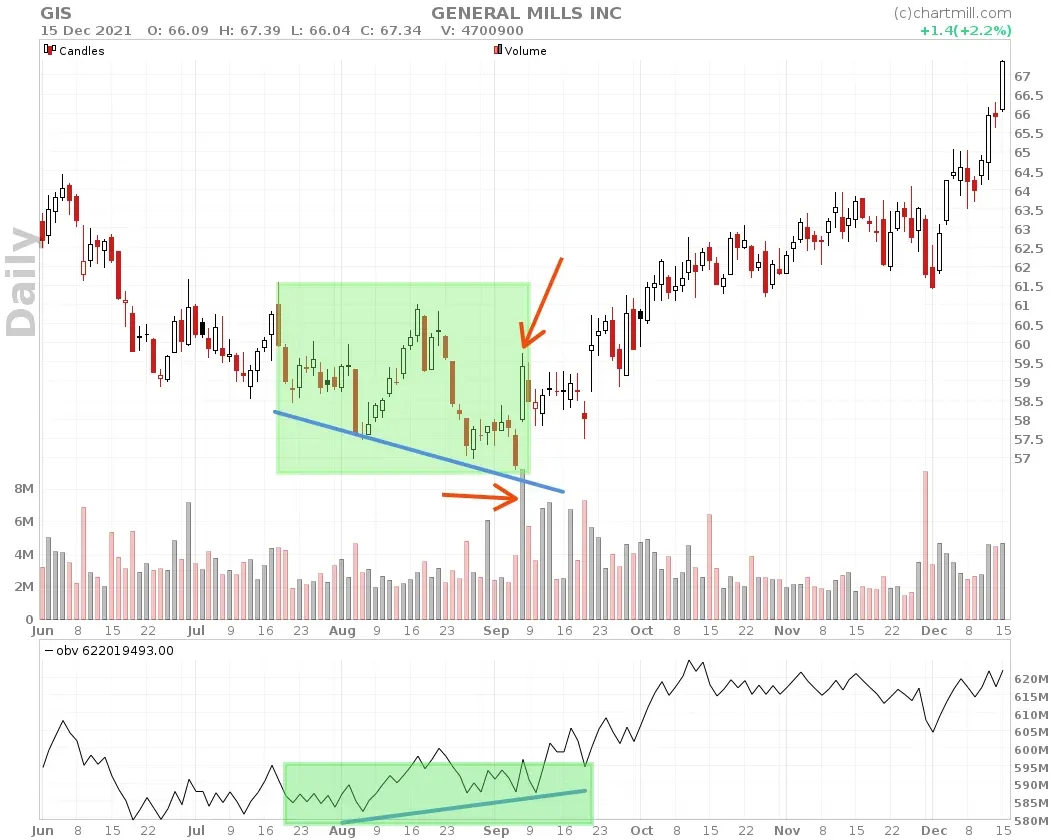
The General Mills stock falls to a new low in early September 2021, contrary to the OBV indicator which shows a higher bottom (=divergence) and thus provides a warning that the current price decline is losing momentum, to say the least. This warning is supported by the strong increase in price the day after the new low, which was accompanied by a huge volume of buyers (see the red arrows on the chart above).
Sideways Price Movement
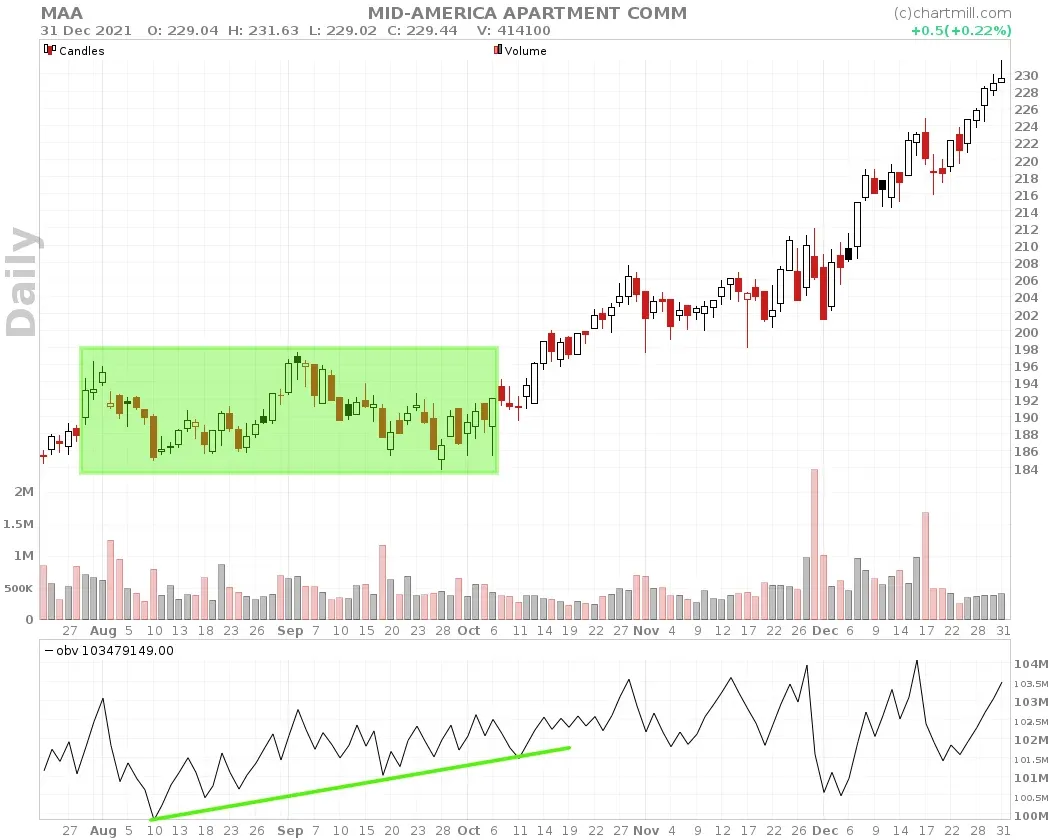
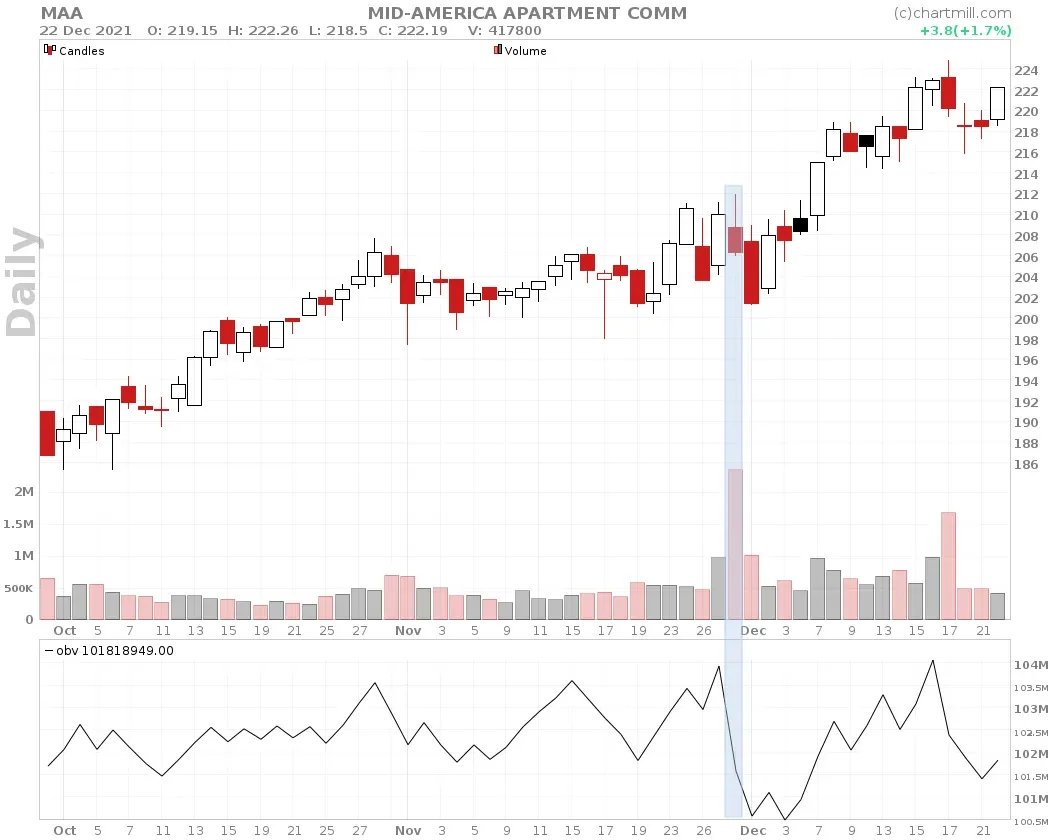
Even in a stock that has been moving sideways for a long time, you can spot divergences using the OBV indicator, which provides additional information about the strength and extent of a price movement. The chart above shows the Mid-America Apartment stock. Since the end of July 2021 until mid-October, the price has been moving rather sideways between $184 and $198. During this period, you can clearly see that the OBV indicator is rising. Around mid-October, the stock breaks out of the existing range on the upside and continues to rise to $230 by the end of 2021.
A FEW FINAL CONSIDERATIONS WHEN USING THIS INDICATOR
Just like all other indicators, the OBV indicator is not perfect. Therefore never use this indicator on its own as a signal to buy or sell positions. The indicator is very useful to protect open positions. For example, if you notice a clear divergence between the evolution of the price and the indicator, this is a first early warning signal that the current trend is losing momentum. You could then, for example, place the stoploss a bit closer to the current price in order to protect a larger part of the open profit.
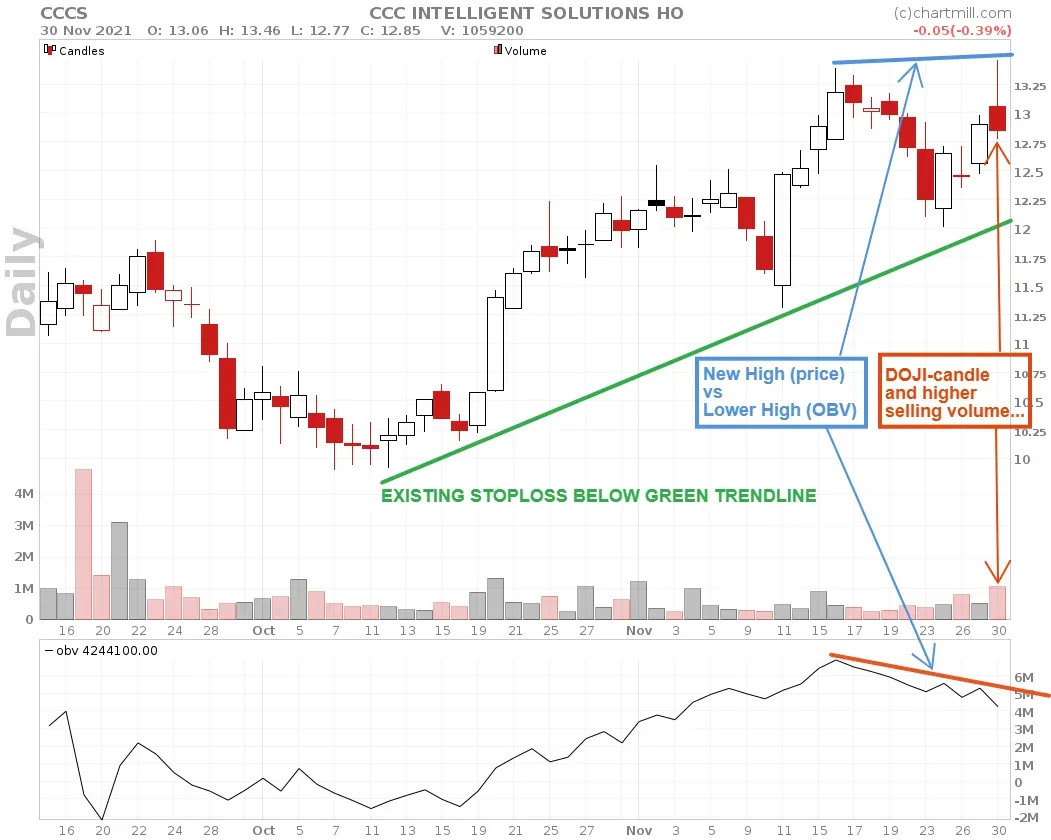
In the CCCS example above, the stoploss is initially below the ascending green trend line. However, the divergence signal allows us to anticipate a possible further decline and to raise the stoploss in this case to just below the $12.75 level.
Beware of sudden violent volume spikes. These usually occur at times when important news regarding the company is announced. Although the effect is only temporary, it can also cause the OBV indicator to show a very extreme upward or downward value while this extreme movement is not visible on the price chart. So always look at the indicator over a sufficiently long period before interpreting it.