Understanding the Dark Cloud Cover Pattern in Trading
By Kristoff De Turck - reviewed by Aldwin Keppens
~ 4 minutes read - Last update: Apr 19, 2024
What is a Dark Cloud Cover Pattern?
It's a candlestick pattern that forms when a bullish trend is about to come to an end and a trend reversal is imminent. The pattern consists of two candlesticks, with the first being a long bullish candlestick (white or green) and the second being a long bearish candlestick (black or red).
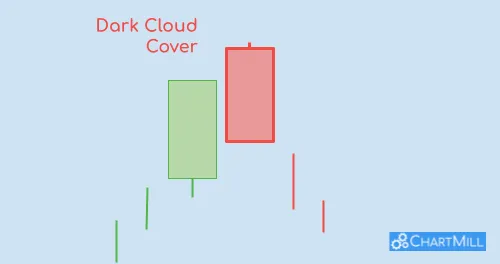
The bearish candlestick opens above the close of the previous day's bullish candlestick but eventually the closing price is below the midpoint. This formation suggests that buyers were initially in control but then lost their momentum, allowing sellers to take over.
This pattern should not be confused with other similar patterns, such as the bearish engulfing pattern or the bearish harami pattern. While they may look similar on a chart, they have slightly different characteristics and implications.
Origin of the name
The name "dark cloud cover" comes from the appearance of this formation on a candlestick chart, where it looks like dark clouds hovering over the previous day's "sunny" bullish trend.
When you see a dark cloud cover pattern forming on a chart, it suggests a possible trend reversal where you should consider securing your profits from outstanding long positions or even open a short position.
How the Dark Cloud Pattern Forms
-
The trend before the pattern occurs is bullish. A white/green candle becomes visible within that uptrend where the price closes near the high. This is a sign of strong buying momentum.
-
The following day the candle opens with a gap up but during the trading session the positive momentum disappears completely and the price drops again.
-
A bearish candle appears whose close is below the middle of the previous bullish candle. This is a sign of bearish momentum.
If the pattern occurs at the end of a temporary price recovery within a bearish main trend, reliability appears higher.
Example of a Dark Cloud Cover Candlestick Pattern
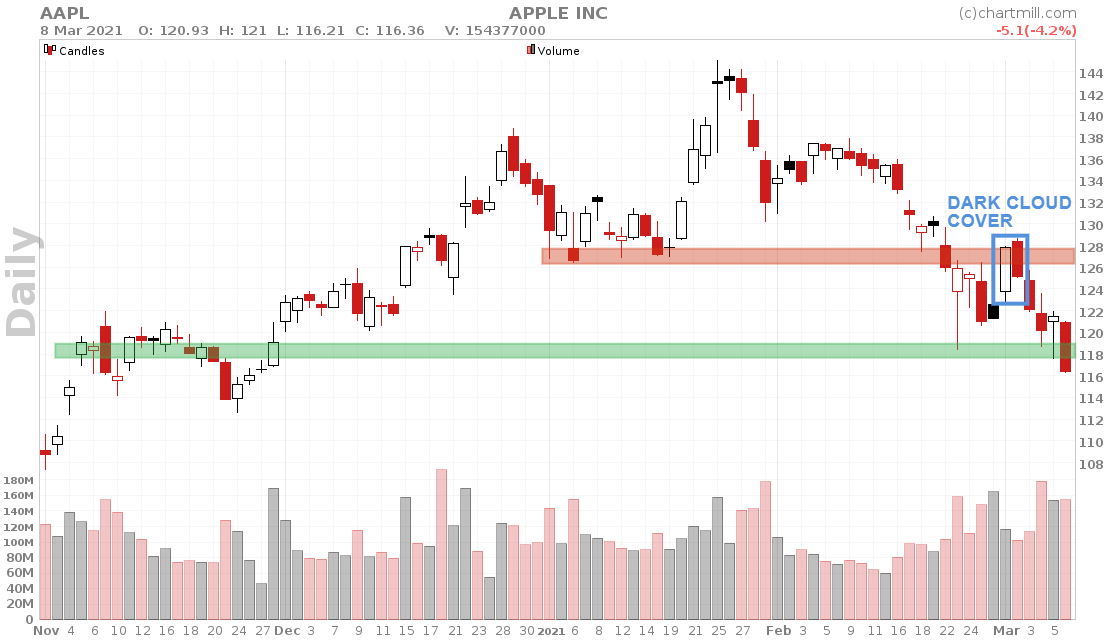
One example of this pattern occurred in Apple Inc.'s stock chart on March 1st & 2nd 2021; A small "price retracement" was visible in the form of a strong rising white candle where the price closed near the highest intraday price.
The following day the price initially opened higher but eventually closed firmly lower and the dark cloud pattern became visible.
Notice how the pattern formed at a price level that had previously acted as support several times but now became resistance.
-
The close of the second red candle in the blue frame can be used to open a short position the following day. This way the trader anticipates a continuation of the bearish main trend.
-
A stop-loss can be placed above the same candle.
-
The price zone at the level of the green horizontal line can be used as a first price target.
Identifying a High-Quality Dark Cloud Cover
Now that we know what a dark cloud cover pattern is, let's dive into how to identify it. There are several key features to look for when identifying the pattern, including candlestick shape and color, volume levels, and location within the trend.
Candlestick shape and color
The pattern consists of two candlesticks: the first one is bullish (green) and the second one is bearish (red).
The second candlestick must open above the high of the previous day but close below its mid-point. This creates a dark cloud-like appearance on the chart that can be easily recognized.
Volume levels
When identifying a dark cloud cover pattern, it's important to pay attention to trading volume.
High volume on the second bearish day confirms that sellers have taken control of the market. If there's low trading volume, it could mean that there isn't enough conviction behind this reversal signal.
Location within trend
This signal works best when it occurs in a short uptrend that is part of a bearish main trend. The pattern is an indication that the bearish main trend will continue.
Resistance levels
When this signal appears at or near resistance level(s), it may give a stronger indication of reversal possibility.
TIP: Be very strict when using this pattern. Only keep patterns in which both the first and second candles are very clear and pronounced (long candles). The close of the first bullish candle should be (almost) equal to the daily high. The close of the second bearish candle should be near the lowest intraday price.
FAQ
What is the success rate of the Dark Cloud Cover Pattern?
According to “Bulkowski on the Dark Cloud Cover Candle Pattern”, the Dark Cloud Cover pattern signals a bearish reversal 60% of the time.
The best way to use this pattern in a trading strategy occurs during an upward recovery movement in a main downtrend. The pattern then signals the end of the short-term uptrend, with the stock moving again in the direction of the existing downtrend.
What is the difference between a piercing pattern and a dark cloud cover?
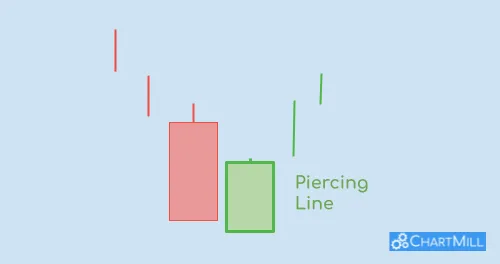
Within the concept of technical analysis, these two patterns are each other's opposites. A dark cloud cover is a bearish candlestick pattern visible at the end of an uptrend. A piercing line is a bullish reversal pattern that forms at the end of a downtrend.
In the case of the piercing line, the first candle is bearish. The following day the price opens with a gap down but buyers enter the market and the price eventually ends higher than the midpoint of the first candle. So the second candle is bullish with a close near the High Of Day (HOD).

