Bearish Harami Pattern: Data-Driven Guide to Market Tops | ChartMill
Quick Summary: Spotting the Bearish Harami Top
- The Core Signal: A critical two-day bearish reversal pattern that warns an uptrend is losing its structural integrity. It’s the market’s way of applying the brakes.
- Visual Markers: Look for a dominant green "mother" candle followed by a small, hesitant "child" candle (an Inside Day) that fails to reach new highs.
- Market Sentiment: This setup reveals a shift from buyer euphoria to silent distribution. The bulls are exhausted, and the bears are starting to test the waters.
- Risk Management: Do not short on the pattern alone. High-probability trades require a breakdown below the mother candle’s low, ideally confirmed by a bearish divergence in the On-Balance Volume (OBV).
- Take Action: Scan for these topping signals across thousands of stocks instantly with the [ChartMill Bearish Harami Screener].
In my years of navigating the financial markets, I have learned that the most profound shifts often start with a whisper rather than a roar.
While many traders chase loud, aggressive breakouts, I have found that the bearish harami pattern offers a more subtle and often more insightful look into the changing tides of market momentum.
In this guide, I will share everything I know about the bearish harami, from its psychological roots to the cold, hard statistics that define its success in the modern trading era.
The Visual Mechanics of a Stalling Trend
Just as we explored in our deep-dive of the bullish variant, the visual metaphor of the ‘mother' and 'child' remains the central anchor here. However, the emotional context is flipped. While the bullish variant signals the quiet birth of hope at a market bottom, the bearish harami represents the silent onset of doubt at a peak.
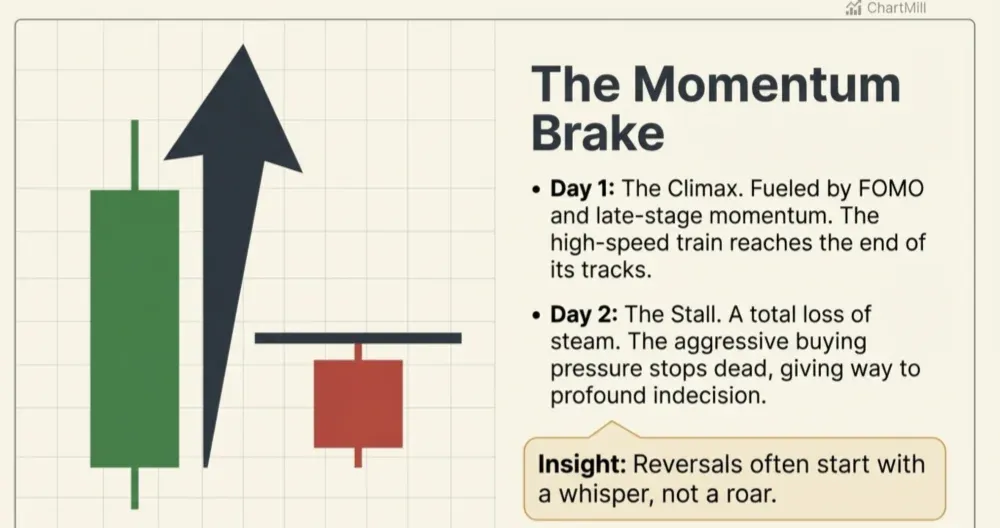
Think of it as a high-speed train reaching the end of its tracks. The first large bullish candle represents the climax of the buying frenzy, fueled by momentum and perhaps a bit of "FOMO" (Fear Of Missing Out).
The second, smaller candle, however, represents a total loss of steam. It is a visual confirmation that the aggressive buying pressure that fueled the uptrend has suddenly stalled, giving way to indecision. In my experience, when the market stops dead in its tracks like this at a peak, it’s rarely a sign of a pause, it’s the silence before the bears take over.
The Blueprint of a Top: 5 Essential Criteria for the Bearish Harami
To separate a true reversal from a mere pause in a rally, I apply a more rigorous set of filters than most. Unlike the bullish pattern which seeks signs of life in a dying trend, the bearish version must prove that the "bullish engine" has actually stalled.
-
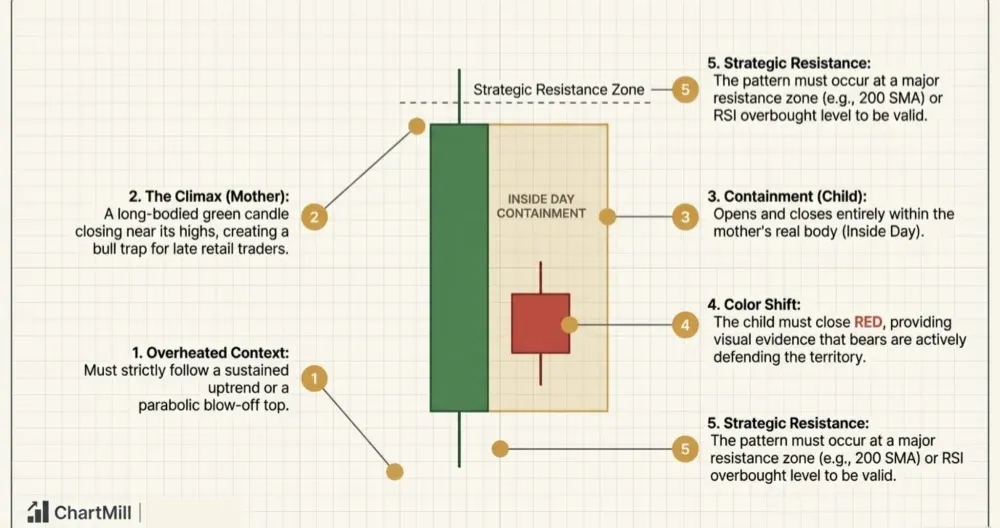
The Overheated Context (Preceding Trend) The pattern is meaningless in a sideways or declining market. I only look for this setup after a sustained upward move or a parabolic "blow-off" top. The market must be in a state where buyers are starting to feel the weight of overextended prices.
-
The Climax Candle (The "Mother") The first day of the pattern must be a definitive, long-bodied bullish candle. It represents the last gasp of the bulls. Ideally, this candle should close near its high, creating an illusion of strength that lures in late-coming retail traders, the classic "bull trap."
-
Price Confinement (The Inside Day) The second candle - the "child" - must open and close entirely within the real body of the previous day's candle. In the trading world, we call this an Inside Day. This shows that the price is no longer able to reach new highs, effectively "containing" the momentum within the previous day’s range.
-
The Color Shift (Sentiment Change) While some textbooks say the color of the second candle doesn't matter, I disagree. For a high-probability bearish harami pattern, I want to see that second candle close red (bearish). It’s the visual evidence that the bears have successfully defended the territory.
-
Strategic Resistance Placement A Harami in the middle of nowhere is just noise. The most powerful setups occur when the "mother" candle hits a major resistance zone, a long-term moving average (like the 200 SMA), or an overbought level on the RSI.
The Psychology: What the Market is Whispering
I believe every candlestick pattern tells a story of human emotion.

On Day 1 of a bearish harami, the bulls are celebrating. Confidence is high, perhaps driven by good news or sheer momentum, and the price closes near its highs.
However, Day 2 introduces a shift. Something changed overnight, perhaps profit-taking began, or "smart money" institutions started lightening their loads. Instead of continuing the rally, the market hesitates. This small red candle represents uncertainty and a breakdown in the previous bullish consensus.
When I see this, I don't just see shapes; I see the bulls starting to lose their grip.
Hard Facts: Backtest Statistics and Reality
As much as I love the theory behind these candles, I am a firm believer in backtesting.
Anecdotal evidence is nice, but data is better. According to quantified studies of the S&P 500, the bearish harami is one of the most frequent patterns you will encounter.
Here is what the data tells us about its reliability:
- Frequency: Over 250 observations in the S&P 500 since 1993.
- Success Rate: Studies show a success rate of approximately 66% in certain conditions, though other configurations yield a lower 47% accuracy.
- Profitability: Interestingly, the average return per trade is a modest 0.05%.
My takeaway? The bearish harami pattern is not a "holy grail" that will make you rich overnight. It is a bias-defining tool that helps you predict the flow of momentum, but it works most effectively when paired with other practices.
Trading Strategies: Adding Confluence
In my experience, trading a bearish harami candle on a "naked" chart is risky. I prefer to stack the odds in my favor by using indicators. Here are my favorite pairings:
1. On-Balance Volume
In our technical breakdown of the bullish variant, we relied heavily on the RSI to spot oversold conditions. However, when we are dealing with market tops, I prefer to look at the "fuel" behind the move. This is where the On-Balance Volume (OBV) becomes your most valuable ally.
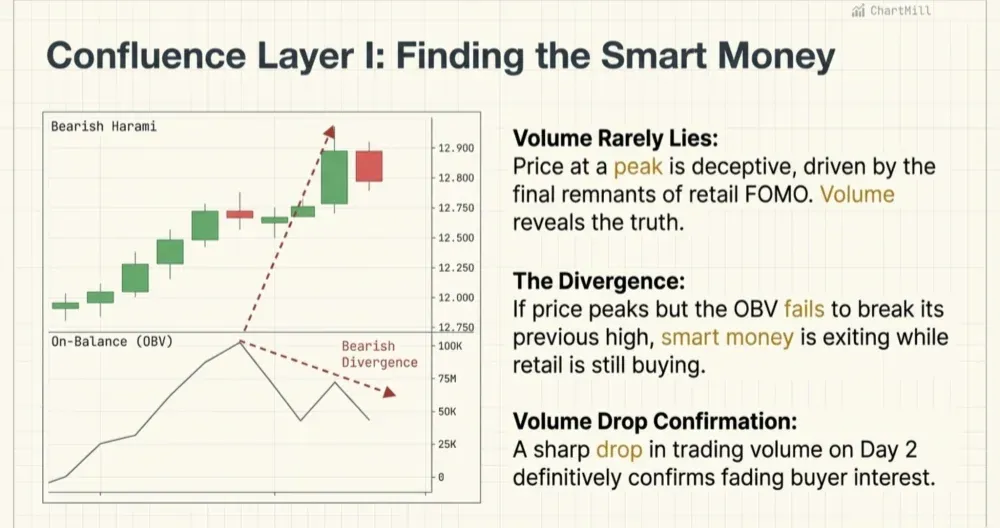
Price can often be deceptive at a peak, driven higher by the final remnants of FOMO. But volume rarely lies. When a bearish harami pattern forms, I immediately check for a bearish divergence on the OBV indicator.
If the large "mother" candle reaches a new price high, but the OBV line is already starting to slope downward or fails to break its previous peak, it reveals a hidden truth: the "smart money" is exiting while the retail crowd is still buying. This divergence, combined with the indecision of the Harami’s "child" candle, provides a high-conviction signal that the path of least resistance has shifted to the downside.
2. Volume Analysis
Volume is the fuel of the market. If volume drops off entirely during the second candle, it serves as a confirmation of fading buyer interest.
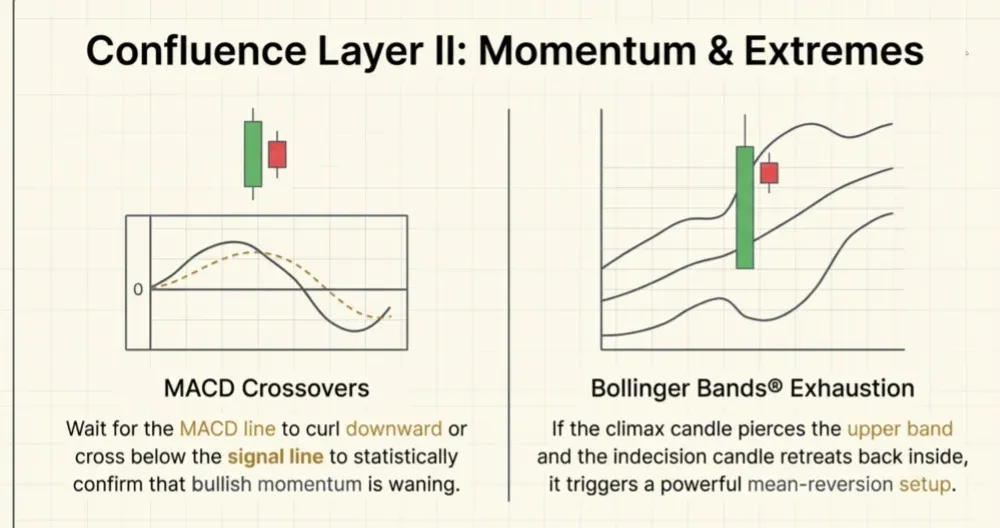
3. MACD Crossovers
I use the Moving Average Convergence Divergence (MACD) to confirm trend shifts. I wait for the harami to form near a resistance level and then check if the MACD line has curled downward or crossed below the signal line. This confirms that the bullish momentum is indeed waning.
4. Bollinger Bands® Exhaustion
Bollinger Bands are fantastic for identifying price extremes. If the "mother" candle pierces the upper Bollinger Band and the "baby" candle retreats back inside the band, I view this as a mean-reversion setup. It shows the bulls overextended themselves and are now pulling back.
Risk Management: Protecting Your Capital
Trading without risk management is just gambling with extra steps. When I enter a trade based on a bearish harami, I follow these rules:
Entry Point: I typically place my entry a few ticks below the low of the second (baby) candle. I prefer to wait for a "confirmation candle" to close below that low to ensure the reversal is real.
Stop Loss: I place my stop loss a few ticks above the high of the mother candle. If the price moves past this point, the bearish thesis is invalidated.
Take Profit: I target the nearest key structural support level or previous minor swing low. I aim for a risk-reward ratio of at least 2:1.
Comparing the Harami to Other Reversal Patterns
It is easy to confuse the bearish harami with other patterns. I find it helpful to understand the differences:
-
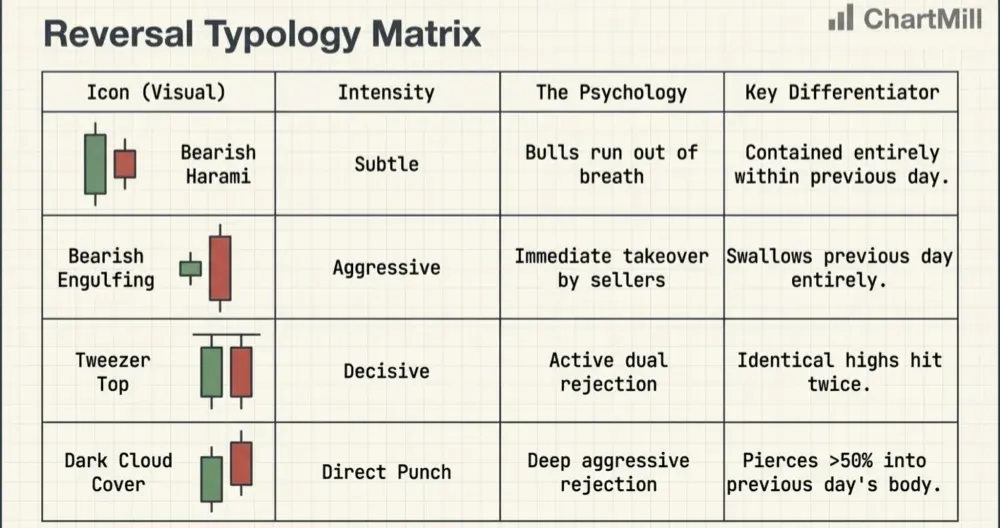
Vs. Bearish Engulfing: In an engulfing pattern, the second candle is the large one that swallows the first. The engulfing pattern is generally more aggressive and considered a stronger signal than the harami because it shows an immediate takeover by sellers.
-
Vs. Tweezer Top: Tweezer tops have two candles with identical highs. This demonstrates an active, dual rejection of a specific price level, which I find to be a more decisive signal than the hesitation shown in a harami.
-
Vs. Inside Bar: While they look identical, the "inside bar" doesn't care about color and is often a continuation pattern. The bearish harami is specifically a reversal pattern with strict color requirements (Green then Red).
Common Pitfalls to Avoid
Even the best patterns fail, and I've certainly seen my fair share of "failed haramis." Here are the three most common mistakes I see:
-
Ignoring the Asset's "DNA": Some assets simply don't react well to haramis. I always look back at the chart history to see if previous patterns resulted in a reversal or if they were just "noise".
-
Using the Wrong Timeframe: In my experience, the bearish harami pattern is prone to false signals on timeframes lower than the daily chart. On a 5-minute chart, a small red candle inside a green one is often just a momentary pause, not a trend change.
-
Ignoring Market Context: A bearish harami in a single stock doesn't mean much if the broader index (like the S&P 500) is in a parabolic uptrend. Market context always takes precedence over any single pattern.
My Personal Opinion: A Subtle Tool for the Patient Trader
To be honest, I think the bearish harami is often unfairly labeled as a "subpar" pattern because it lacks the immediate visual violence of a bearish engulfing candle. However, I find its subtlety to be its strength. It gives you an early warning that the wind is changing direction before the storm actually hits.
I don't recommend relying on it solely, but as a "confirmation bias" for a larger short thesis, it is gold. If you see a bearish harami candlestick forming at a major resistance zone while RSI is screaming "overbought," that is a signal you simply cannot ignore.
"The Bearish Harami Cross: When Indecision Turns Lethal"
You might occasionally encounter a version where the second candle is a Doji (a candle where the open and close are nearly identical).
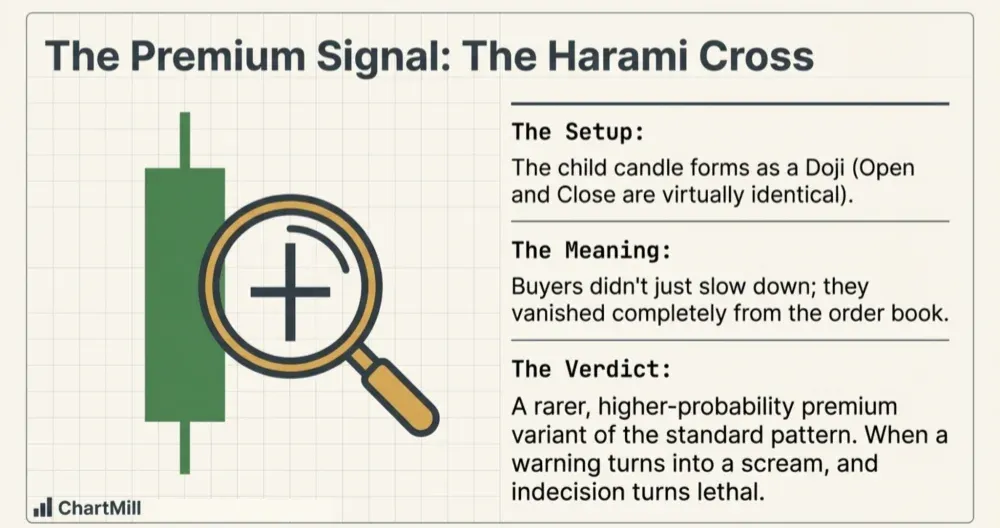
This is known as a Bearish Harami Cross. While the standard pattern is a warning, the Cross is a scream. It shows that the buyers completely vanished. In my experience, the Cross has a higher success rate but occurs less frequently. Treat it as a 'premium' version of the signal you are already tracking.
Conclusion
Mastering the bearish harami requires patience and an eye for detail. It is a story of transition, from bullish dominance to cautious hesitatio. By recognizing the five identification criteria, understanding the underlying psychology, and adding layers of indicator confluence, you can transform this subtle signal into a powerful part of your trading arsenal.
Remember, the goal isn't to be right 100% of the time; it's to have a high-probability setup with a defined exit strategy. The bearish harami pattern provides that structure, allowing you to manage risk while you wait for the bears to take control. Keep your stops tight, watch your volume, and always respect the broader market trend.
Kristoff | ChartMill
Related articles, Screens & videos
- Bullish Harami Pattern - Beyond the Pregnant Candle: A Complete Guide to Modern Reversals
- Mastering the Bearish Harami: The "Silent" Reversal Signal Every Trader Needs (Video)
- The Bearish Harami Candlestick Pattern Screen in ChartMill
Frequently Asked Questions: Navigating the Bearish Harami
1. Is the Bearish Harami a signal to sell immediately?**
In my experience, I treat the bearish harami pattern as a yellow traffic light, it means 'slow down and prepare to stop,' not necessarily 'slam on the brakes.'
It is a warning that the prevailing uptrend is losing its structural integrity. Before entering a short trade, I always wait for confirmation, such as a price break below the 'mother' candle’s low or a third bearish candle that confirms the shift in power."
2. Does the location of the 'child' candle within the 'mother' matter?
It absolutely does. While any 'inside' placement technically qualifies as a bearish harami candle, I look for the second candle to form in the upper half of the mother candle’s body.
This indicates that buyers tried to extend the rally but were immediately halted. This 'congestion' at the top often leads to a more significant breakdown than a candle that forms near the middle.
3. How does a Bearish Harami differ from a Dark Cloud Cover?
Both are bearish reversal signals, but they differ in intensity. A Dark Cloud Cover is a more aggressive rejection where the second candle 'pierces' deep into the first. The bearish harami, by contrast, is a more subtle loss of volatility.
Think of the Dark Cloud Cover as a direct punch from the bears, while the Harami is the bulls simply running out of breath. Both are valid, but the Harami requires more patience for confirmation.
4. Why is volume so critical for this specific pattern?
At market tops, volume tells the real story. If the large 'mother' candle was formed on high volume but the second, small bearish harami shows significantly lower volume, it confirms that the buying interest has evaporated.
When you see a Harami appearing on declining volume after a long rally, it’s a high-conviction sign that the 'smart money' has already left the building.
5. What is the best timeframe to trade the Bearish Harami pattern?
The bearish harami pattern is most reliable on the Daily and Weekly timeframes. On shorter timeframes, like a 5-minute chart, these 'inside days' can often be noise caused by a temporary lack of liquidity.
On a Daily chart, however, a Harami represents a significant psychological shift among institutional investors that often precedes a multi-week correction.