Terry Smith Portfolio Metrics To Find Quality Stocks
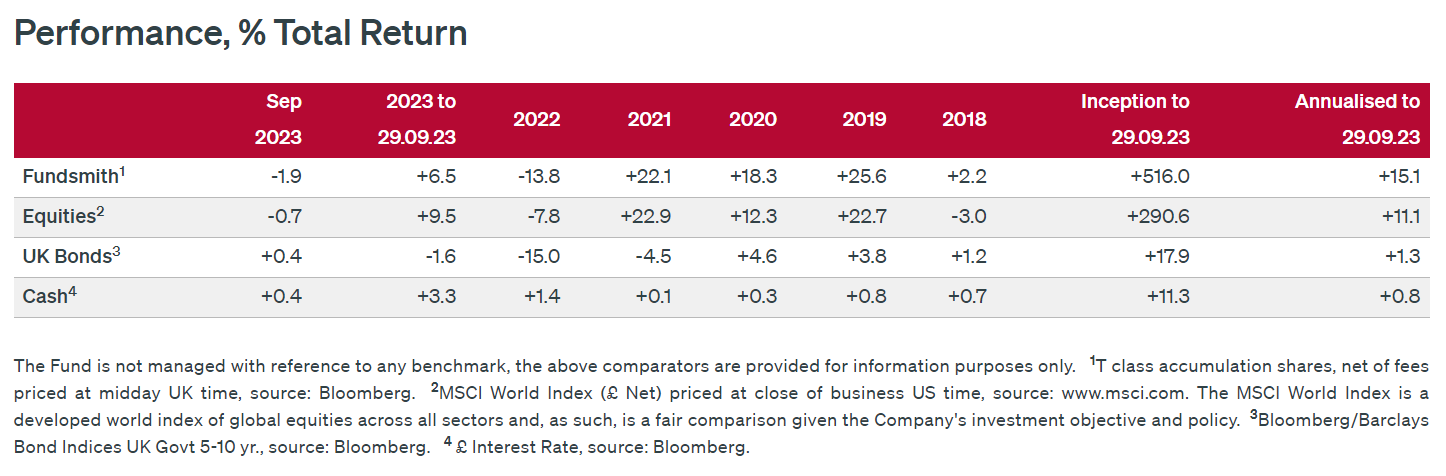
Terry Smith is a well-respected British investor and fund manager, best known as founder and CEO of Fundsmith LLP, an investment firm he founded in 2010, achieving a compound annual return (CAGR) of 15.6% (after expenses) since inception. That represents a total return since inception of 516% (09.29.23).
Smith is a strong proponent of Quality investing, focusing on companies that provide products or services of outstanding quality with a sustainable competitive advantage and strong cash flows.
Another important aspect in Smith's investment approach is the focus on minimizing trading costs by trading as little as possible and primarily letting time do its work.
Investment Approach
Anyone who delves a bit into Terry Smith's investment strategy will quickly notice where he got his inspiration. The similarities to Warren Buffet's approach to value investing are great. Both focus exclusively on highly profitable companies, maximizing their competitive advantage over their sector or industry peers whereby they still have the ability to grow strongly. All of this should be driven by a strong management team.
The common denominator is - no surprise - Benjamin Graham, the father of value investing. The difference between Terry Smith and Warren Buffet/Benjamin Graham is the focus on the importance of "undervaluation" being much less of a factor with quality investors like Terry Smith. The typical quality investor would rather buy an outstanding product at a fair price than an ordinary good product at a cheap price.
Simplicity Is Key
Fundsmith's success is due in large part to its puckish performance but what has undoubtedly also played a role is the way in which mostly complex investment concepts are explained in plain human language.
Smith has succeeded in summarizing his approach in three core principles aimed purely at creating long-term capital gains:
1. Only buy quality companies
The criteria are strict. Only companies with solid balance sheets, predictable and increasing revenues,high returns on employed capital and structurally strong competitive position are considered.
2. Don't overpay for those companies ( Note, this is not the same as 'cheap')
In making this point, the fund manager goes against the stock market wisdom "buy low and sell high". Of course, it is still important to make sure you don't overpay for a stock, but you should be willing to pay a fair price. The quality of a company and its growth potential is much more important than the price you pay for it. This clearly distinguishes Smith from the pure value investor who primarily looks for stocks that quote significantly below their intrinsic value.
3. Do nothing (and be patient)
This strategy focuses exclusively on the long-term. Companies are bought with the intention of keeping them in the portfolio for as long as possible. As such, short-term price fluctuations should be ignored. This is the only way to take maximum advantage of the power of exponential growth.
In addition to these 3 core concepts, attention is also paid to sufficient diversification; the companies invested in are active worldwide. However, typical cyclical companies (companies whose prices move strongly with the course of the economy), strongly regulated sectors (too little growth potential due to restrictive regulations) and companies that need borrowed money to generate profits (too complex) are excluded.
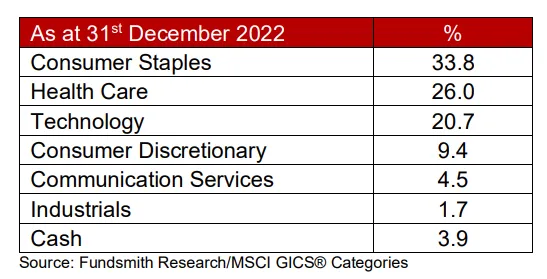
This manifests itself in the sectors included in the Fundsmith as of 2022/12/31:
Smith further suggests relying primarily on one's own analysis and research and allowing oneself to be influenced as little as possible by all manner of market trends, news or bold predictions.
"Stop trying to time the market and macroeconomic events. Instead, focus on high-quality companies that can be resilient over many decades." - Terry Smith
The Terry Smith Portfolio Criteria in ChartMill
Cash Conversion>=90% | At least 90% of EBITDA is converted into cash flow|
This ratio provides insight into the extent to which the company is able to effectively convert profits into cash. The stronger this ratio the easier it is for the company to pay its short-term financial obligations (all debts < 1 year).
Moreover, in times of economic difficulty, such companies will be more resilient to weather this period and are best positioned to reinvest in growth when the economy recovers.
FCF growth 5Y>=0% | In the last 5 years the Free Cash Flow has grown
Quality investors focus on companies with rising profits. This is precisely why the FCF Growth ratio is retained. After all, when it increases (due to more income, reducing costs, etc.) this is often a prelude to higher profits.
In order to avoid making the screen too strict, we do not impose a minimum percentage. We only require growth (>0%).
ROCE(5y)>=15% | A 5 year average ROCE of at least 15%
ROCE is a profitability ratio that calculates how much profit (before interest and taxes) the company can generate with the capital it uses. A high ratio is evidence that the company is using capital efficiently. As for a lot of ratios, this becomes especially interesting if this key number shows growth over several years.
It is evidence that value is indeed being created for investors. That's why here, too, we consider the 5-year average.
P/FCF<=30 | Price to Free Cash Flow is maximum 30
Despite the fact that quality investors are not necessarily looking for cheap stocks, that does not mean they are willing to pay just any price. This indicator tells exactly how much you pay for each $ of free cash flow. Highly overvalued stocks are always to be avoided.
Still, one should not only look at low P/FCF, a slightly higher ratio can be perfectly justifiable in highly profitable companies. It may indicate that investors are willing to pay a premium now because free cash flow is expected to continue growing solidly in the future. A maximum P/FCF ratio of 30 corresponds to an FCF yield of 3.33%
This filter deserves some nuance...
In this video, where Terry Smith elaborates on the free cash flow yield, he states that he demands a return of at least 1% above the expected rate of inflation.
For further details, we would like to refer you to the specific video (starting at 03:14). So in that sense, the filter will have to be adjusted according to current market conditions and inflation rates.
GICS | Sectors included/excluded
Included: Industrials, Consumer Discretionary, Consumer Staples, Health Care, Information Technology, Communication Services
Excluded: Financial Services, Utilities, Energy, Materials, Real Estate
GM>=55% | A gross margin of at least 55%
Gross margin tells something about profitability and provides insight into how price is set and how the company keeps its costs manageable. It is an ideal parameter for comparing companies because revenue is compared after deducting the costs necessary to get the goods sold.
The higher the margin, the better.
OM>=20% | An operating margin of at least 20%
Compared to gross margin, all variable costs are taken into account in this case yet before interest and taxes.
Market Cap: At least Small (300M+)
Avoid very small caps
Interest Coverage>=10
The ICR represents how often interest expenses can be paid with operating income. The formula is simple: operating income/interest expense.
It is a measure of how much profit before interest and taxes can decrease without the company getting into financial difficulty. Acceptable to good is a figure between at least 3 and 5. In this case, we require a multiple of 10....
Debt/FCF<=5 | The debt is less than 5 times the Free Cash Flow
Debt to free cash flow is a financial ratio that compares a company's total debt to its free cash flow. This ratio indicates the ability of a company to pay off its debt using the cash it generates from its operations. This ratio shows how many years it will take to repay all outstanding debts with the current free cash flow.
Zero to 5 years is a good acceptable ratio for quality companies.
'Quality at a fair price' basic screen in ChartMill
Optional filters
To ensure that you only retain companies in which there is sufficient trading volume, you can set a minimum volume via the 'General' tab on the stock screening page. A value of at least 100,000 units traded, for example, is a possibility and will rarely be a problem for U.S. stocks.
However, keep in mind that with such a volume filter, you will probably filter out some non-US stocks that otherwise meet the criteria perfectly. This is why we have not retained this filter in the basic filter settings.
Want to know more about Terry Smith's strategy? Check out these references.
-
Here you will find the "Owner's Manual" for the Fundsmith, explaining the strategy in clear language.
-
Equally interesting are the annual letters to shareholders of which you can consult the most recent (January 2023) via this link.
-
The annual presentation to shareholders can be found on Fundsmith's official YOUTUBE account. Check out the most recent meeting from February 2023.
-
Finally, there is the Terry Smith book "Investing for Growth: How to make money by only buying the best companies in the world - An anthology of investment writing, 2010-20", a collection of Essays and letters that give more insight into his vision and investment strategy.