
How to find the best value stocks?
In this article, I show how I use the stock screener to arrive at a basic list of stocks of interest to value investors. Value investing is a strategy that focuses entirely on the key figures of companies. Using those figures, the market price is compared to the actual value of the company as determined by the investor. If that market price is lower than the 'real' value of the company then the company is considered 'undervalued' and is worth buying for the value investor.
A more in depth intro article on what value investing actually is and what the advantages and disadvantages are can be read here.
When setting the filters, it is important not to be too strict at the start so that we get a wide enough selection.
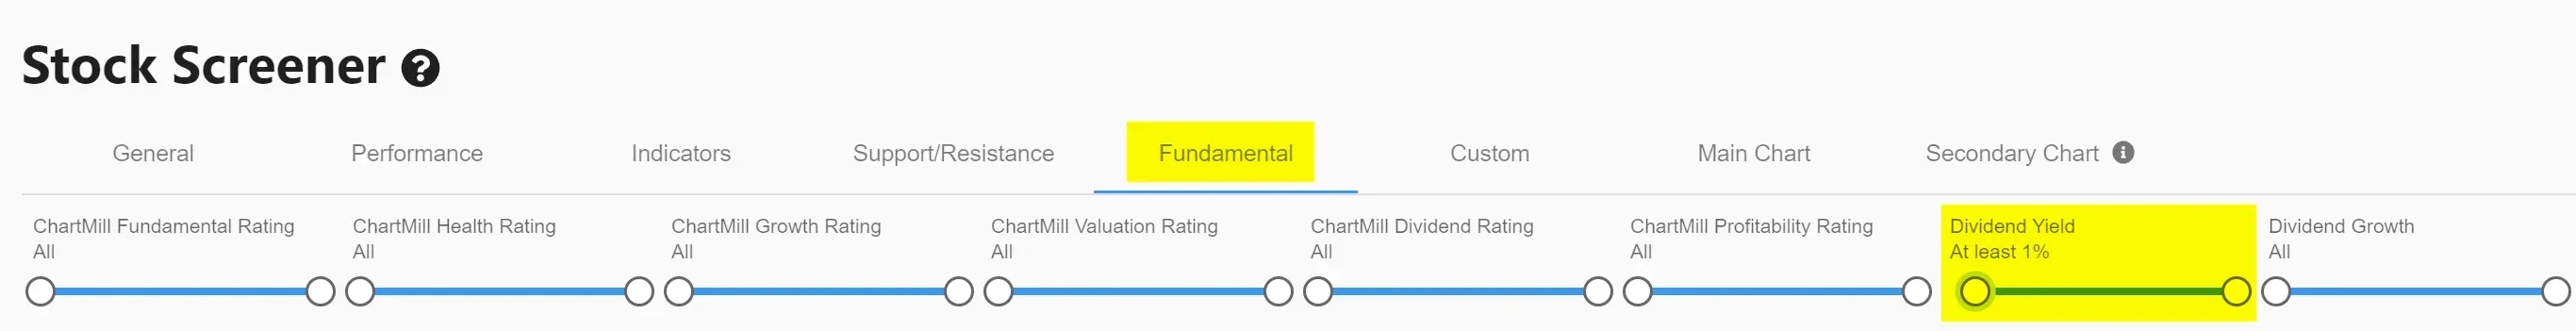
DIVIDEND PAYMENTS
First and foremost, choose companies that structurally pay dividends because this way a passive income is created, in addition to any share price gains. Moreover, companies that pay dividends will generally be considered to be on a more stable growth path.
We primarily select companies that pay a minimum dividend of 1% (dividend yield). The amount of dividend is less important in the first selection, we mainly screen for the presence of dividend. Later, the 'dividend' component can be examined in more detail, for example by looking at the period over which the company has already paid out uninterrupted dividends.
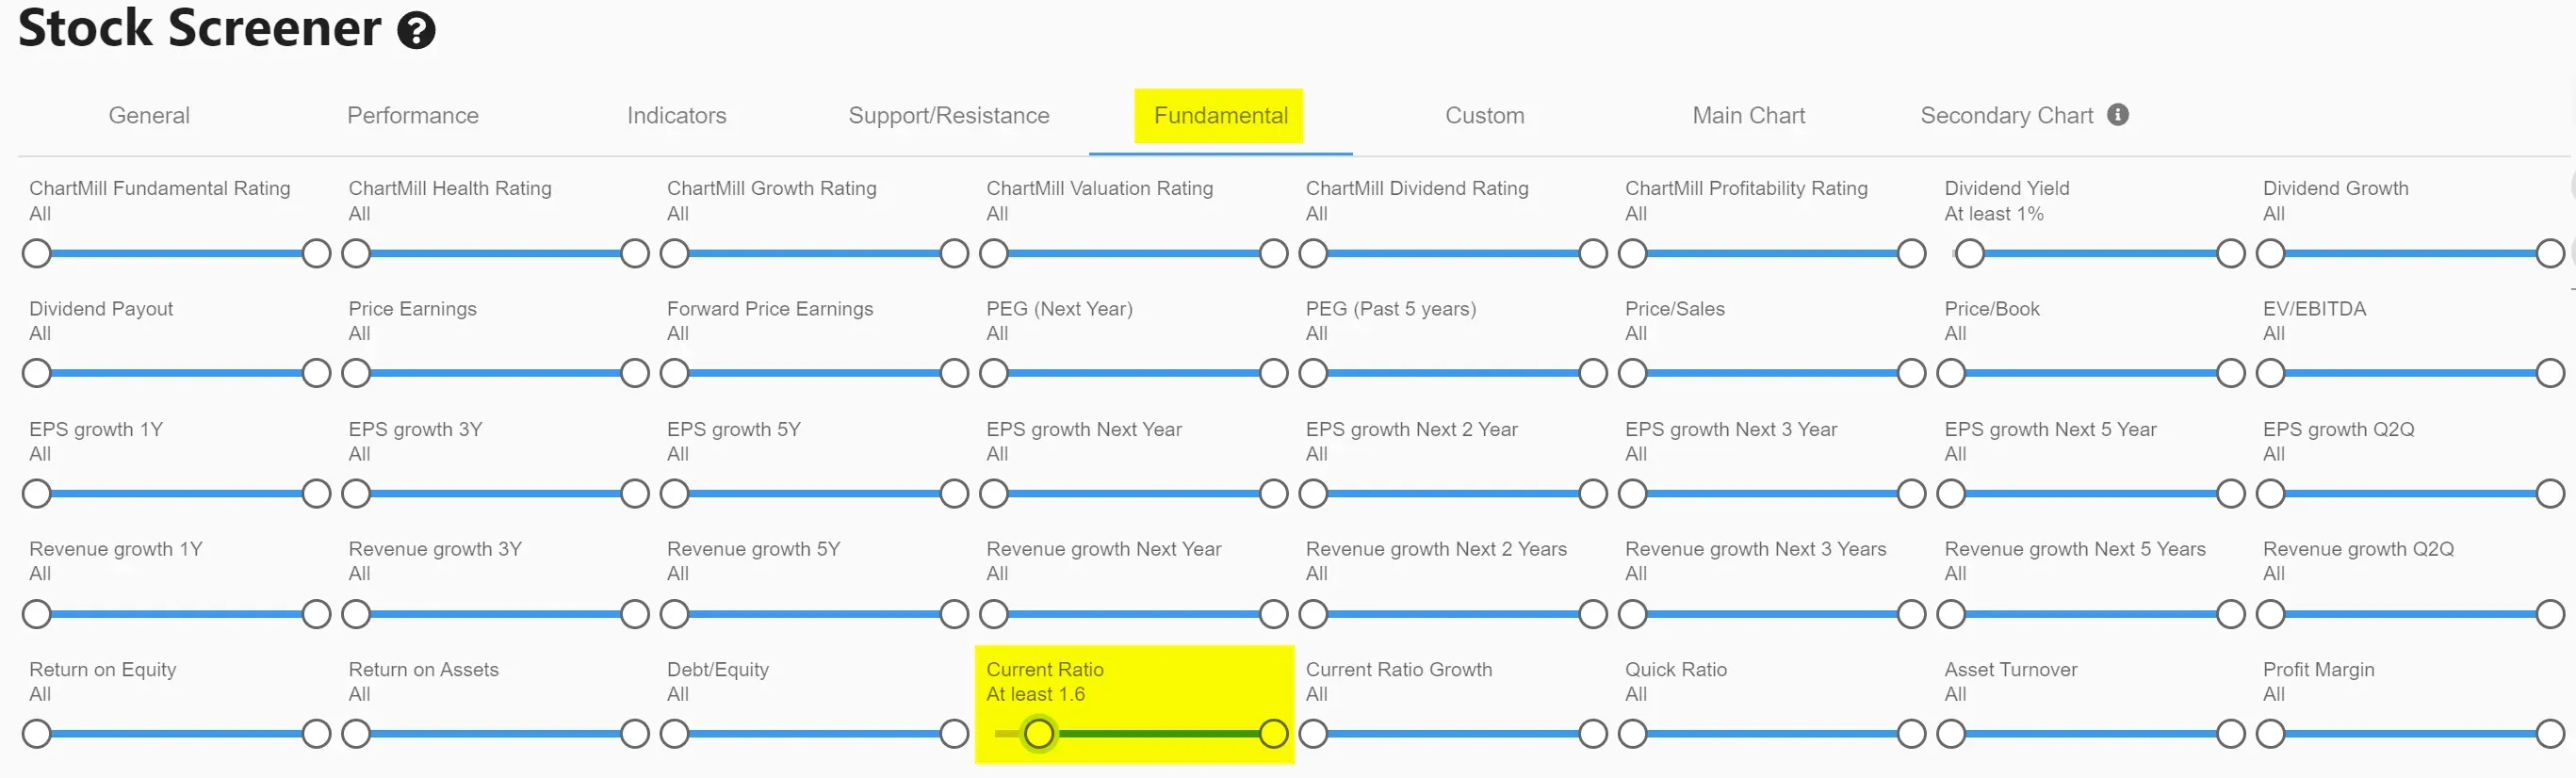
LIQUIDITY OF THE COMPANY
To what extent is a company able to pay its short-term financial obligations that are due within one year (current liabilities)? To find out, the current ratio is used. This is the ratio of current assets to current liabilities. As a rule, the higher the number the better. A current ratio lower than 1 means the company has more short term debt than inventory/cash and we want to avoid that. A current ratio above 1.5 is considered healthy. Often a current ratio of 2 is advised for value investors but as we already mentioned in the intro, we want to obtain a first basic list with the filters.
As a basic filter I use a current ratio of > 1.6
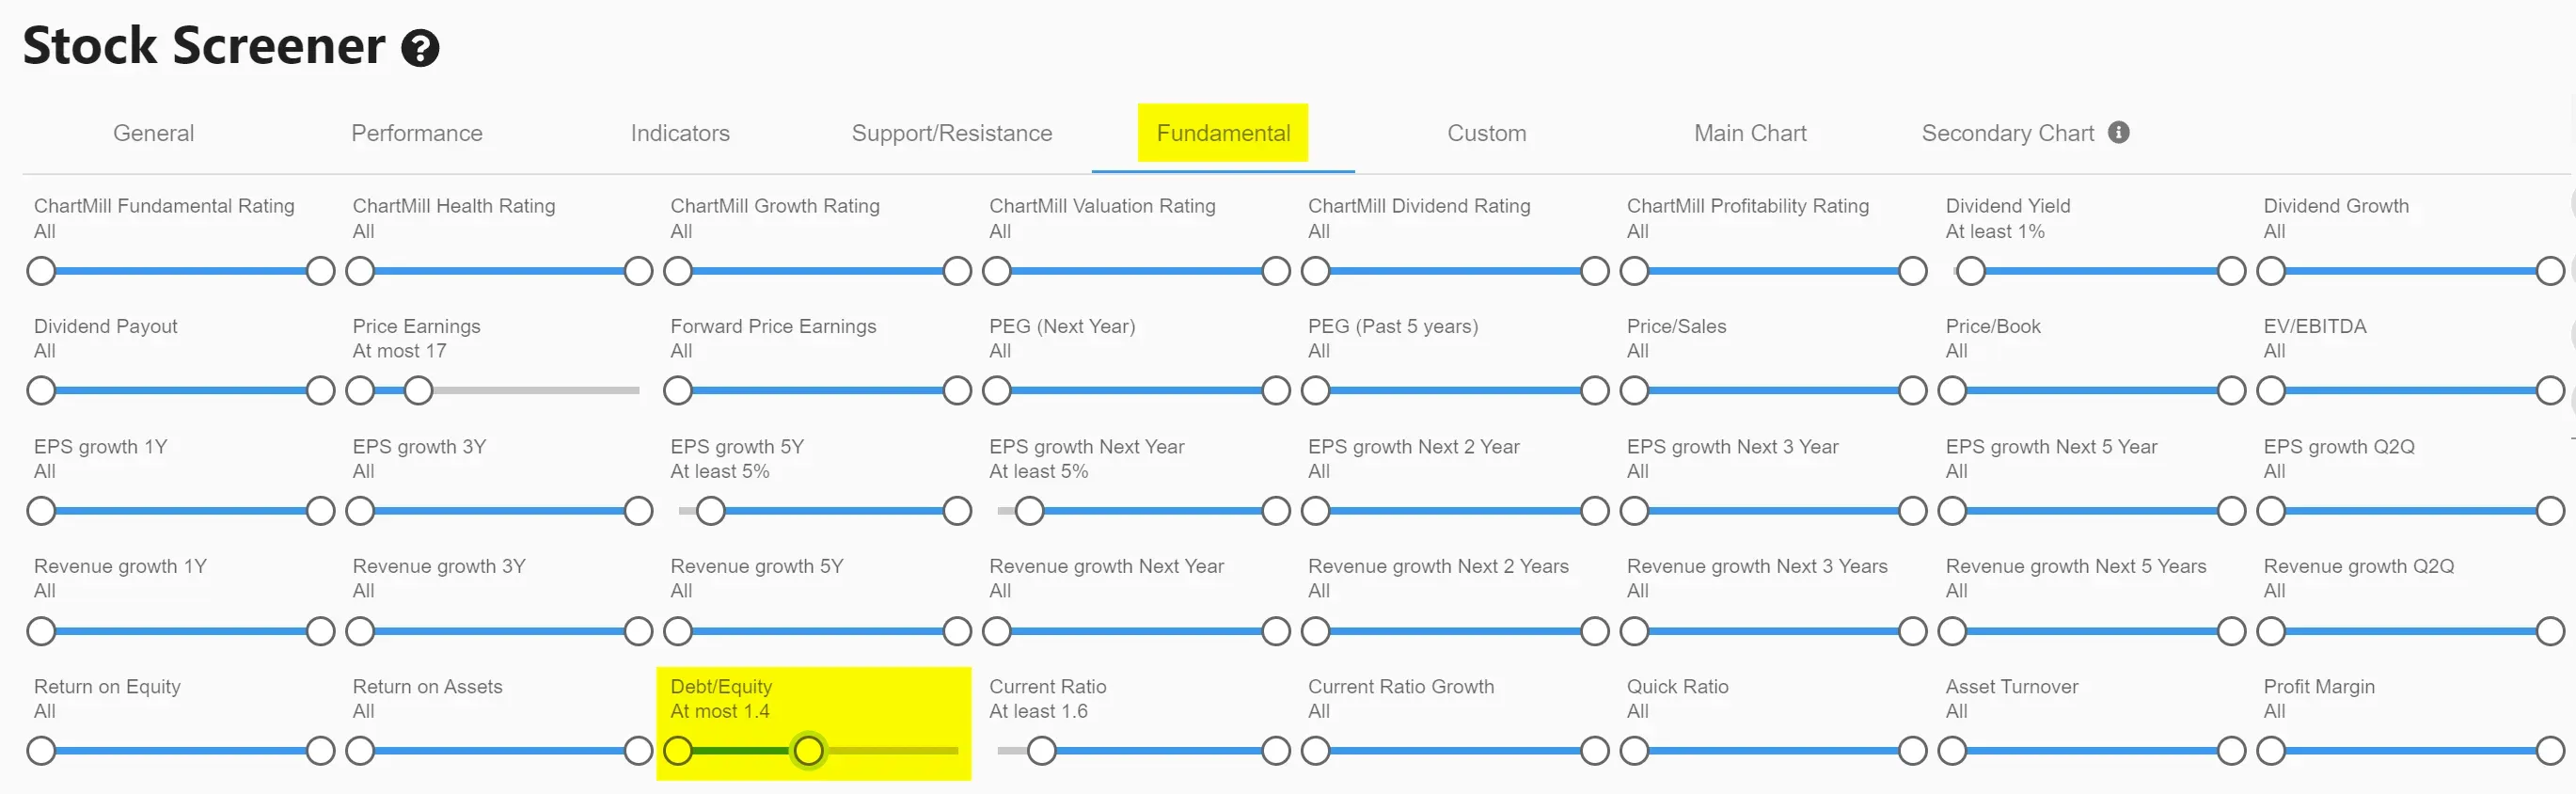
COMPANY DEBT
The fact that companies finance themselves and take on debt should not in itself be considered a negative. But as a value investor, we do screen companies for that level of debt. After all, too much debt constitutes a risk in more volatile times if a company can no longer meet its obligations. We therefore look for companies with relatively low debt because, as a rule, they are more stable and more sustainable.
We use the debt/equity filter and set it to a maximum of 1.4. When interpreting the results, you must however take into account that the debt ratio varies from one sector to another. Some sectors such as the construction industry are much more capital intensive than other more service-oriented sectors.
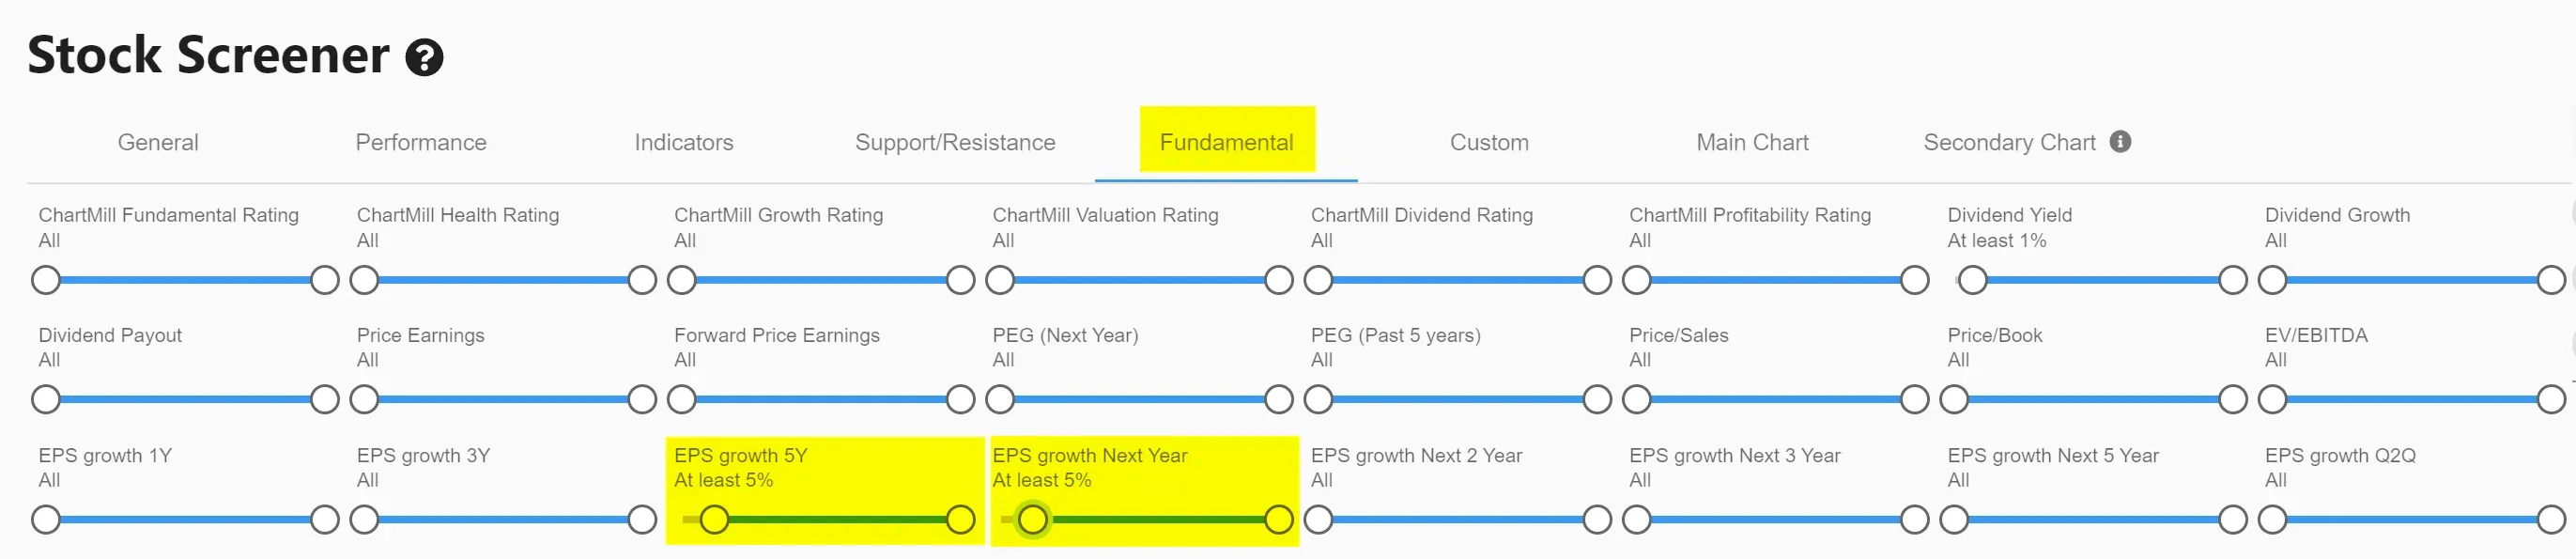
POSITIVE EARNINGS GROWTH
Earnings per share growth (EPS Growth) over several years is another indicator to select companies that are doing well. If profits can be increased over several years, it is a good indication that it is a safe company which reduces your risk. I define that EPS growth over the past 5 years should be at least 5% and i use the same percentage as an outlook for the next year.
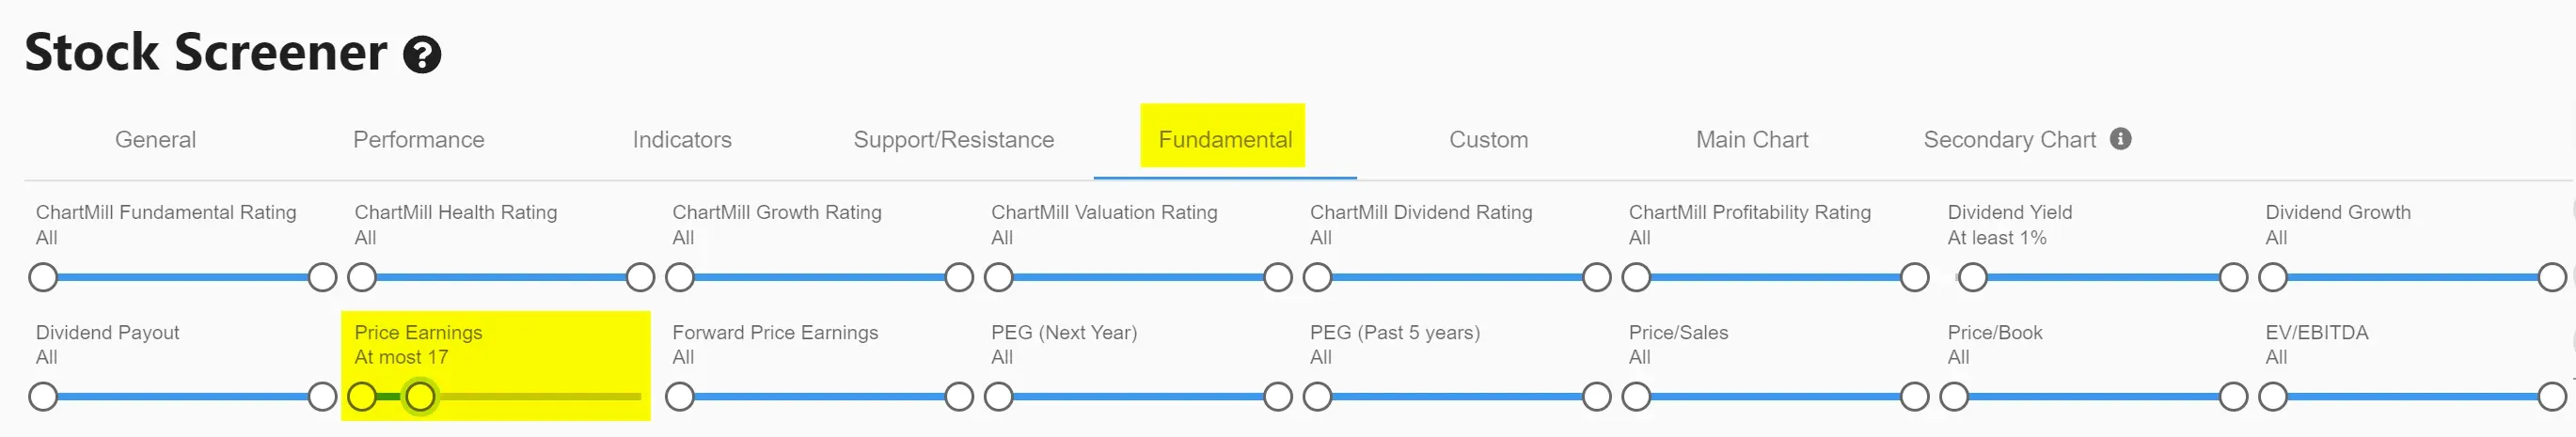
PRICE/EARNINGS RATIO
The trick in value investing is to buy good companies at a price that is lower than their true value. A value investor is a bargain hunter. The Price to Earnings ratio is the ratio of earnings per share to the company's current stock price. The lower this ratio, the cheaper the company and the more likely it is that the company in question is undervalued.
Keep in mind that Price to Earnings ratios vary widely by sector or industry, so companies should only be compared within the same sector. A low Price to Earnings ratio does not necessarily mean that companies are cheap. It can also mean that the company is doing worse and is in financial difficulty.
I use a maximum price to earnings ratio of 17 as a starting value.
PRICE TO BOOK VALUE RATIO
Price/Book value is another valuation ratio that provides an indication of the underlying value of a company. Investing in stocks that sell near or below their book value makes sense from a value investing perspective.
Book value represents how much a company is worth based on its own finances. For companies, this amounts to the total value of fixed assets minus liabilities. It is - just like the P/E ratio - a valuation ratio that gives an indication of the underlying value of a company. Traditionally, a book value of less than 1 is defined as very interesting for value investors.
However, book value by itself is not a definitive measure of value. This is because book value does not provide a good indication of the value of intangible assets, such as intellectual property rights. Companies that develop software, for example, may be able to develop products at relatively low cost. As a result, the balance sheet may not reflect the true value of the assets. Thus, a company's shares may be trading well above their book value, yet should not be considered overvalued.
Therefore, the book value should be used as a comparator between companies. So we will add this value in the results table so that companies can be compared to each other on this ratio but to be used as a basic filter it is too specific.
OVERVIEW OF THE FUNDAMENTAL FILTERS USED
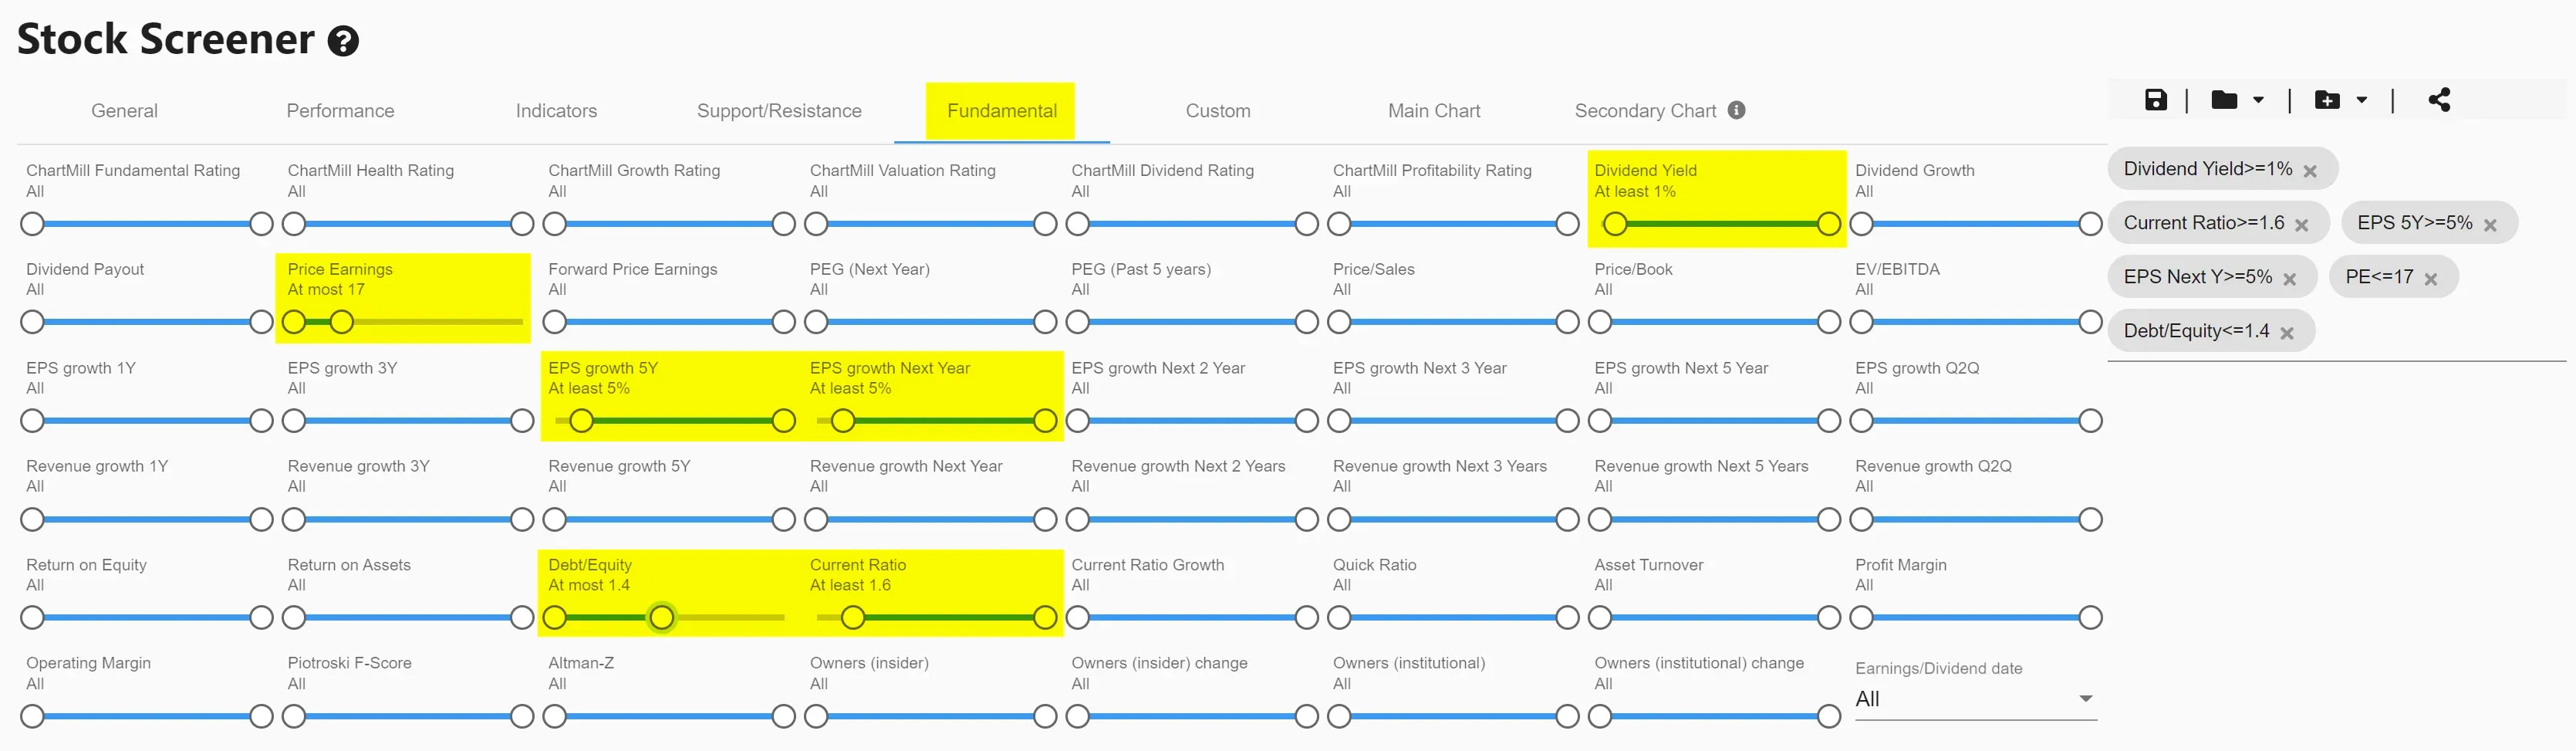
By using the above filters, you already obtain a fairly thinned out basic selection of stocks which you can further investigate. In order to be able to compare the companies properly, it is best to create a separate custom table in which the selected filters and their values are visible.
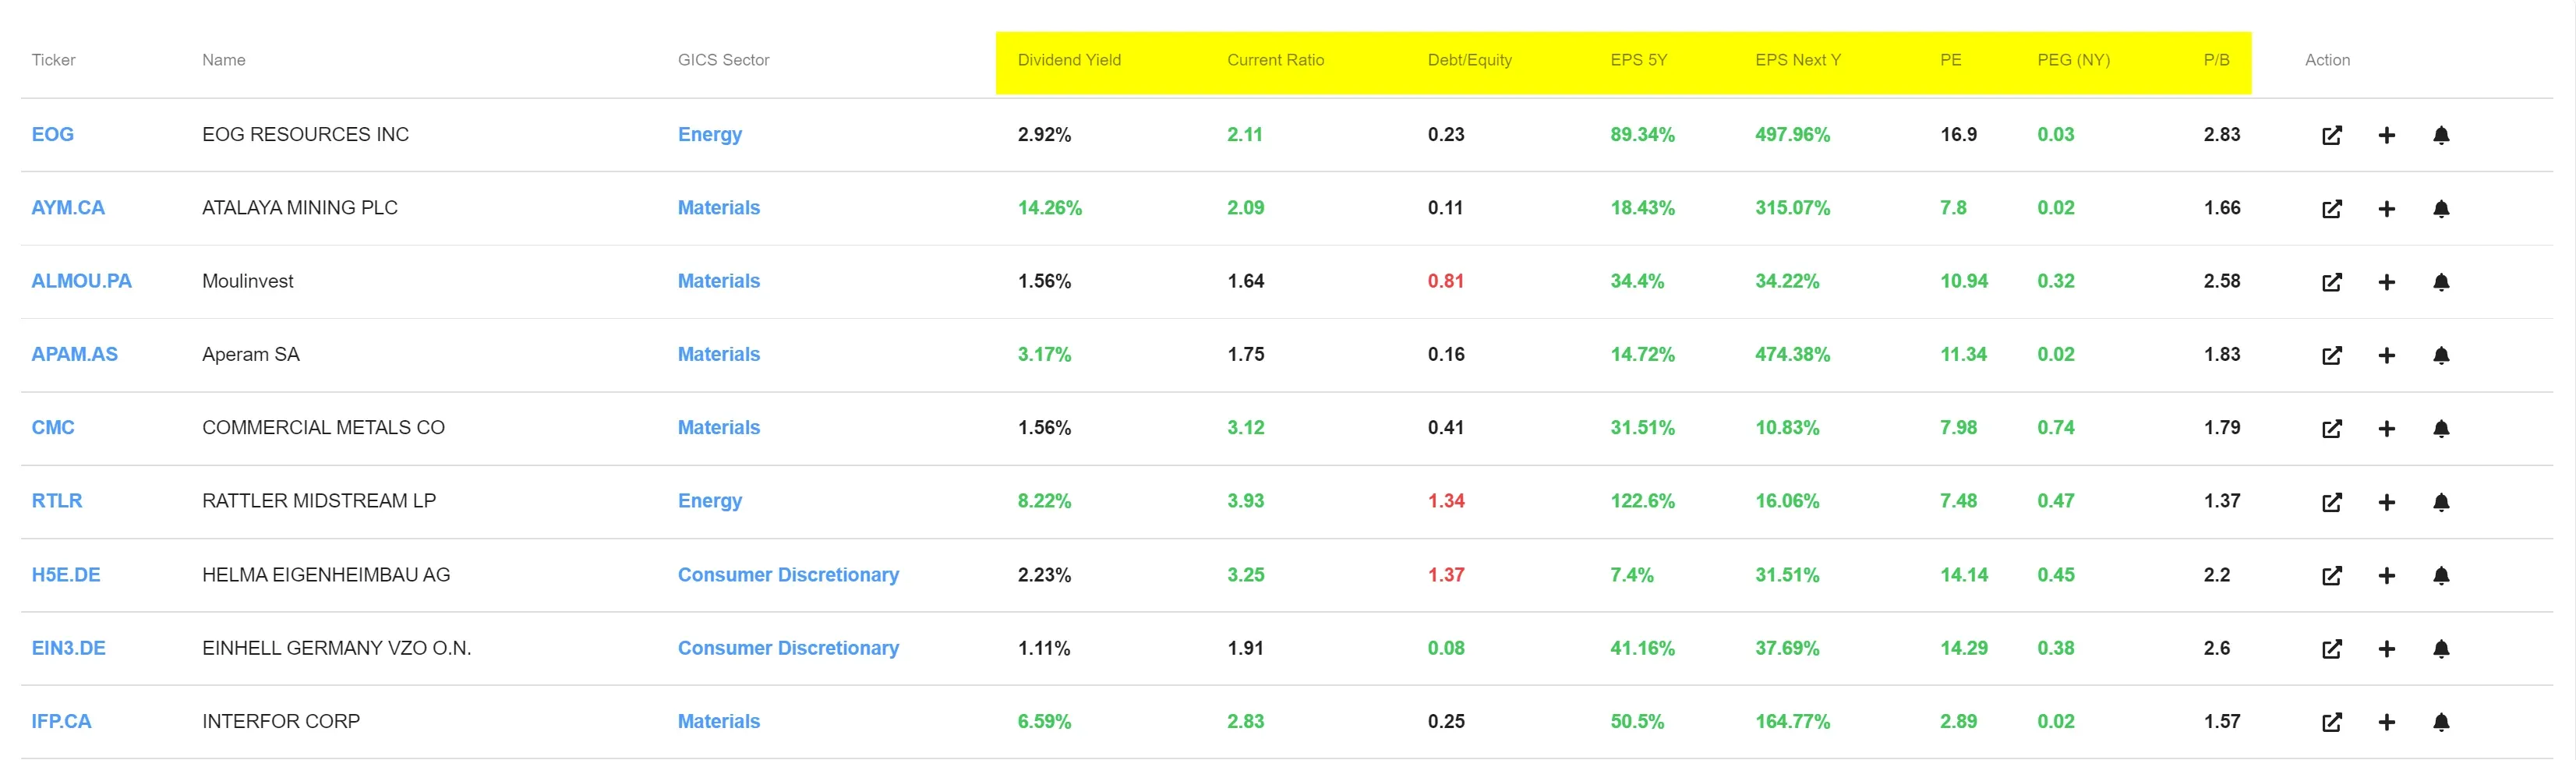
In this video I demonstrate how to make such a table (link will be visible when the video is available).
Besides the price/book ratio that we already discussed above, we also add the PEG ratio in the table. This is a modified version of the price/earnings ratio but also takes into account earnings growth. This is especially interesting to compare companies that have more or less the same P/E ratio. By adding the PEG ratio in the table you get an even more complete picture because it provides a forward-looking perspective.
After this, you can use the 'general' tab to set in which markets or specific sectors/industries you wish to use these filters. The other available filters such as minimum price, volume, ... speak for themselves.
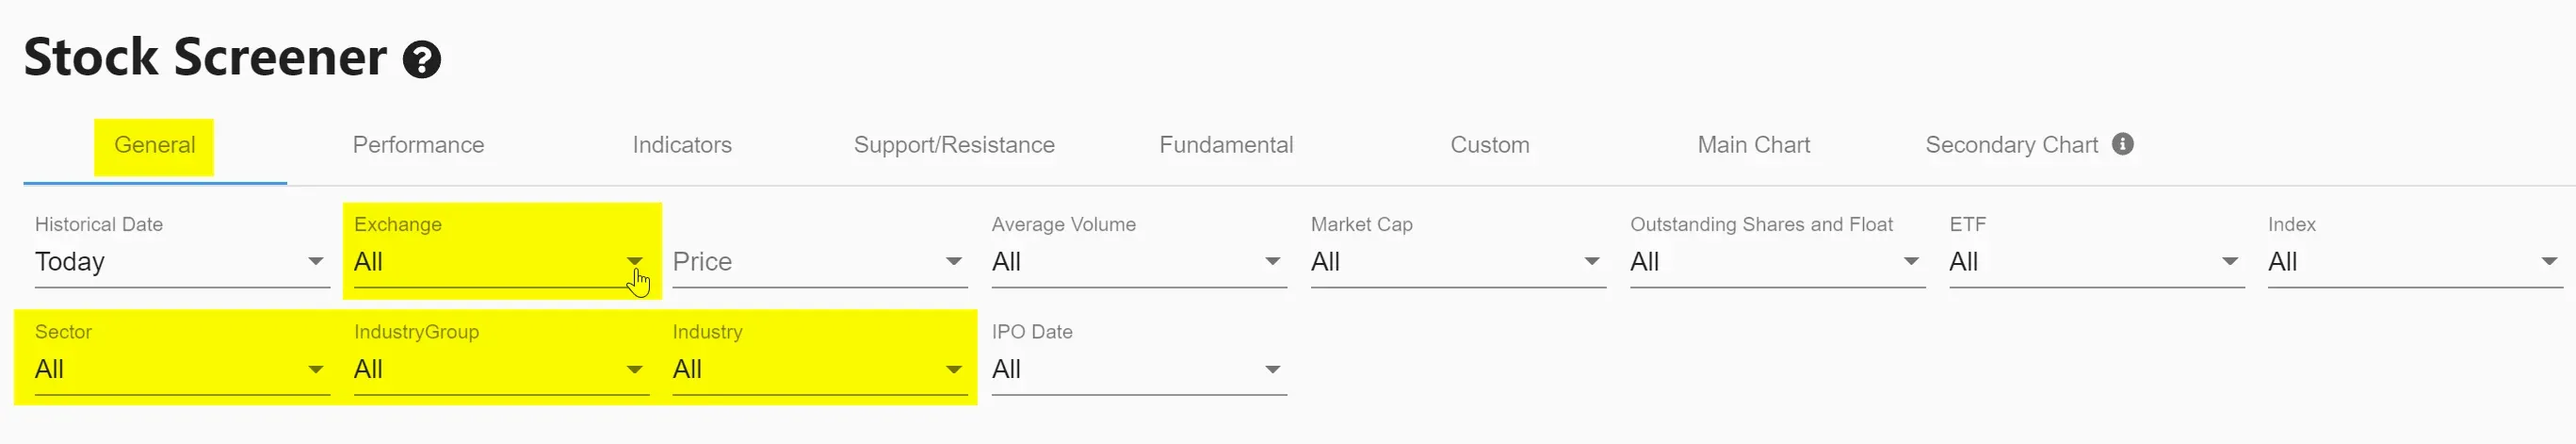
Explore the 'related screens' section next to this article for some predefined trading ideas.