
Evaluating stocks for Dividend Investing
The idea of Dividend Investing is to own dividend paying stocks so you can obtain a passive income from dividend payouts. This article will discuss what you need to look for when evaluating dividend stocks as well as how you can find them on ChartMill.
Dividend Yield and Growth
The Dividend Yield is the yearly dividend expressed as a percentage of the share price. This is also the pure dividend return of your investment. When a stock is for instance priced at $100 and it pays out a dividend of $2 per share each year (= the dividend rate), the dividend yield will be 2%. As the yield is dependent on the share price it will not be a constant number but fluctuate each day. When the share price goes down, the yield will go up. And this brings us to a first pitfall of picking dividend stocks: while a dividend yield of 15% may seem very attractive, it could be very well the result of a huge drop in share price in a recent period. Although this may still seem attractive (a cheap stock!), usually there are reasons for the drop and investors may be expecting things to go wrong for the specific company. When the company is indeed in trouble or faces declining earnings, dividends will be cut.
The Dividend Growth is the average annual growth of the dividend rate measured over the last 5 years. When a company is able to grow its earnings it can usually also pay out a larger cut to the shareholders, which is a good sign.
Payout Ratio
The Payout Ratio is the percentage of net income spent on dividend payments by the company. The payout ratio is a good ratio to evaluate the sustainability of the dividend. When a company pays out 30% of its income it means this number can very easily be maintained and there is enough left over for other investments. On the other side, when a company pays out above 80% of its income not much needs to happen before it may not be able to keep doing so. In this case we can say the current dividend rate is at risk.
A note here is that the Payout Ratio is calculated by taking the TTM (trailing twelve month) numbers for income and dividend payments. These recent numbers may include one time events on both sides (for instance an exceptional extra dividend payout or low reported income because a 1 time investment). To avoid making a decision on the single number it is best to look at the history and trends in the past years to make sure the current number does not differ too much. And when it does differ you probably would like to understand why exactly.
In the Dividend section of the ChartMill fundamental report you can inspect the current Payout Ratio as well as the history of dividend payments compared to the earnings and free cash flow:
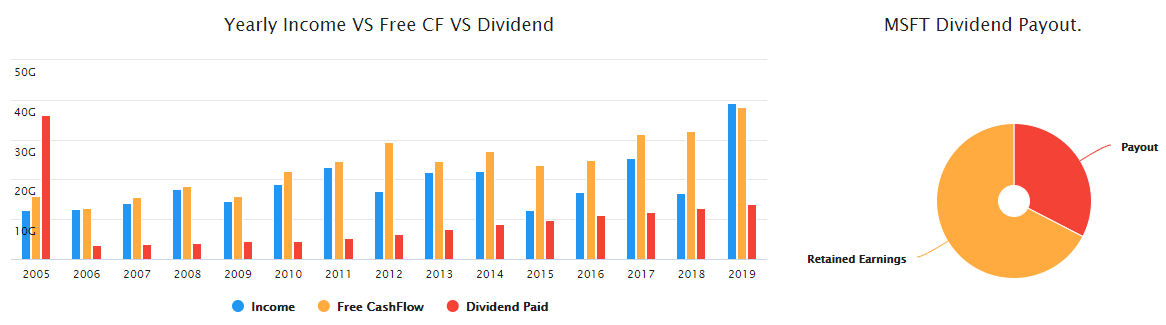
Note that comparing with the free cash flow can also be useful as this is the real cash coming into a company each year. In the example picture above from MSFT we see that dividend wise MSFT has absolutely no issue to pay the dividend it pays. Of course this alone does not make MSFT a good stock for pure dividend investing as it does not have a high yield.
Earnings VS Dividend growth.
Another way of evaluating whether a dividend (and its growth) is sustainable can be done by comparing the past and expected growth of the dividend to the expected growth of the earnings. For instance when a dividend grows by 10% each year, but the earnings are no longer growing it is clear that the dividend growth is not sustainable. In the ChartMill fundamental report you can find the charts and numbers for both dividend and earnings growth.
Dividend history
The more dividend history a company has built, the better our picture of the reliability of the dividend is. Also looking at the history on a chart will give you an idea of the reliability. For example:
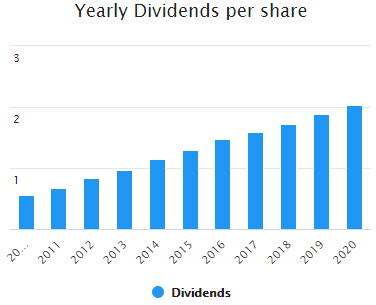
The first chart above shows a stable and reliable dividend growth: each year, the dividend is incremented a bit. The annual growth rate is just below 10% in this case.
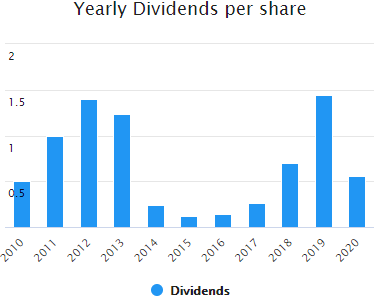
For this second chart the annual growth rate is 41%! The annual growth rate is computed by comparing the rate from 5 years ago to the current rate and then the annualized growth rate is computed from the difference. But this charts looks way more choppy than the previous one and it is hard to tell what we can expect for the next years.
The ChartMill Dividend Rating & Report.
The ChartMill Dividend Rating is part of the fundamental report. The ChartMill Dividend Rating takes into account all the variables discussed above and assigns a rating to each stock. The rating is a number between 1 and 10. The higher the rating, the better the dividend of the stock was evaluated. You can find this rating on the profile pages of each stock and as well in the stock charts or stock screener
- On the profile tab
- On the Fundamental Analysis tab
- In the Fundamental View
- In the Rating table View
- In the Fundamental Report View
The ChartMill Fundamental Report explains how this rating was achieved for each stock. Next to the evaluation of the statements there are also some useful charts for your analysis. These reports can also be found on the profile page of each stock, but can also be displayed in the charts, screener and analyzer.
As always, you need to understand that all analysis is based on past data as well as estimates made by analysts, but this is of course no guarantee for the future. When picking stocks for dividend investing you most probably plan to own them for a longer period of time, so it is good idea to have a good understanding of the business of the company and make your own idea on how this will evolve in the future.
Using the Stock Screener to find the best dividend stocks.
All the properties, ratings and ratio's mentioned above are available in the stock screener. You can find them on the 'fundamental' tab. A first idea would be to just filter for stocks with a high ChartMill Dividend Rating.
We have included a Best Dividend Stocks screen on the trading ideas page. You can also run this same screen in the analyzer.
The analyzer is very easy to browse and has limited configuration options, while you have lots of configuration options in the screener.
Enjoy!