
Trading breakouts is a well-known technique from technical analysis which is mainly used by price action traders. The breakout strategy can be very profitable if you manage to focus only on the very best setups.
Momentum and volume are of major importance.
Watch this video "A complete ChartMil workflow for a breakout swing trading strategy" if you want to learn more about the exact rules for breakout trading.
But even with the very best setups, you'll never be able to avoid that for a number of breakout setups the price will eventually drop below the breakout level and thus the breakout will fail. That in itself is not a problem, even if half of the setups fail, you can still be perfectly profitable with a breakout strategy.
For example, did you know that with a profit target that is twice as large as your risk you only need to be correct in 40% of the cases to be consistently profitable?
Let's do a quick calculation after 10 breakout trades:
- 6 trades closed with a loss of 1% > -6%
- 4 trades closed with a profit of 2% > +8%
The difference, 2%, is your profit.
An unsuccessful bullish breakout is due to the fact that the resistance above which the price initially broke out still appears to be too strong and sellers have taken advantage of this to short the stock.
If sellers are strong enough, you often get a real reversal movement in which the bullish breakout was not only eliminated but the price falls further back into a new downtrend.
Speculating on such false breakouts is also a strategy that can be profitable. In ChartMill, you can screen such setups just as well.
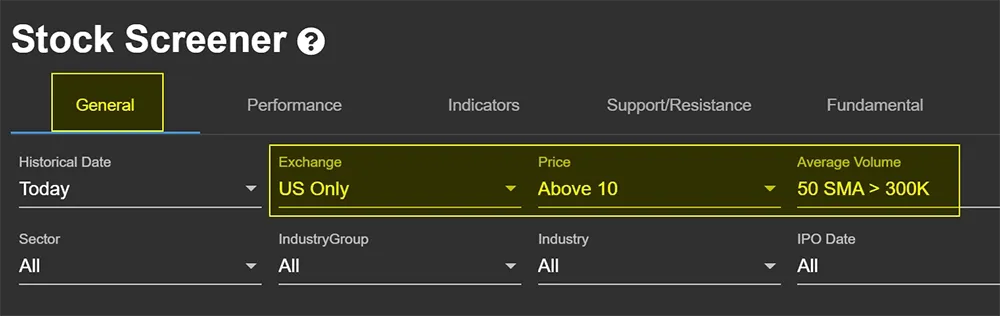
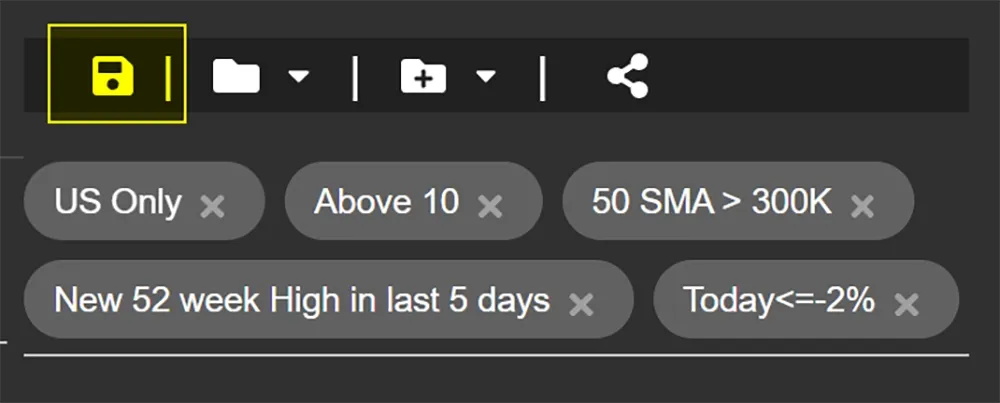
Select the stock screener page and first select the general tab where you set a few general filters. For this example - on the date of 2022-08-03 - I use the following settings:
- Exhange: US only
- Price: above $10
- Average Volume: 50SMA > 300,000
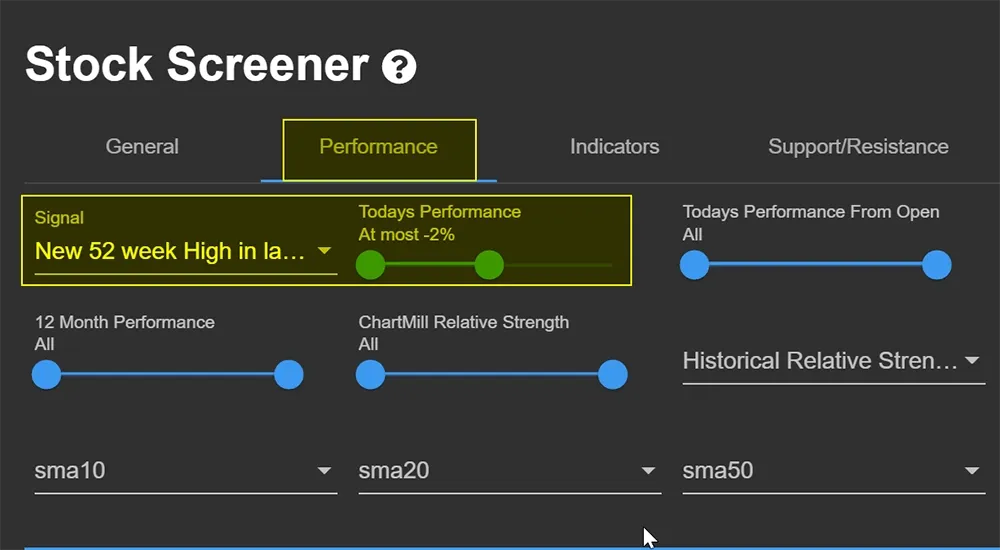
Then select the 'performance' section and pick the following settings from the dropdown menu under the 'signal' tab:
- New 52-week high in last 5 days
- Below 'Todays Performance' slide the small circle from right to left to -2%. This sets up a filter that states that the price must have fallen by at least 2% today.
Now let’s take a closer look at the results, two charts that immediately stand out (screen results on 2022-08-02 EOD):
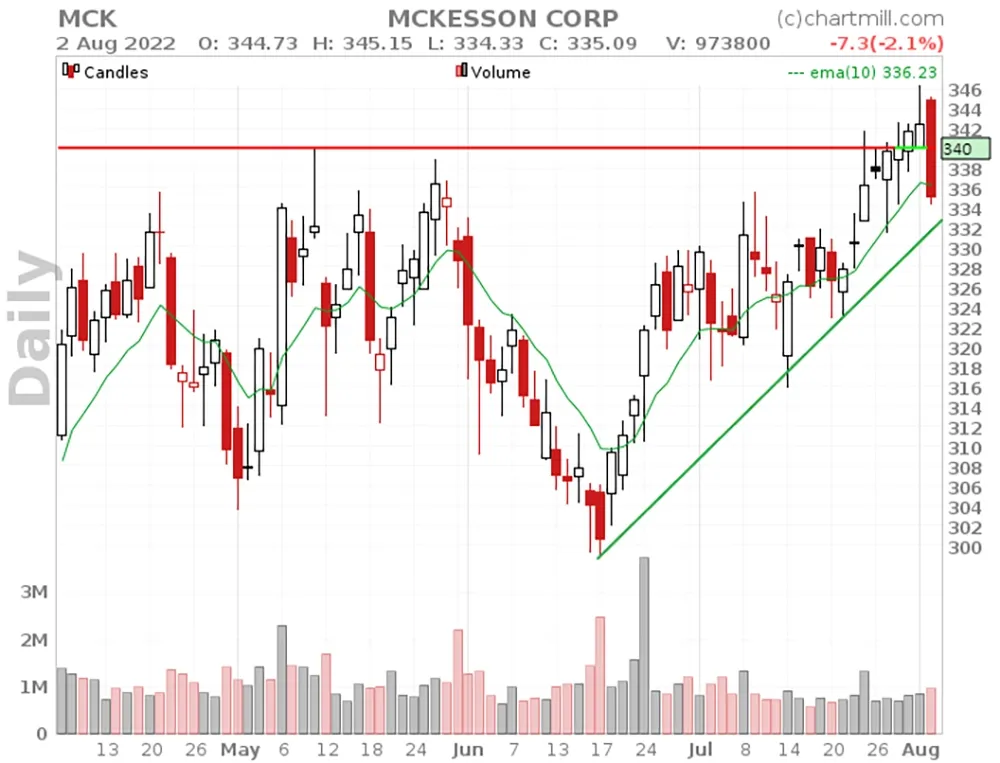
MCKESSON CORP (NYSE:MCK)
SCIENCE APPLICATIONS INTE (NYSE:SAIC)
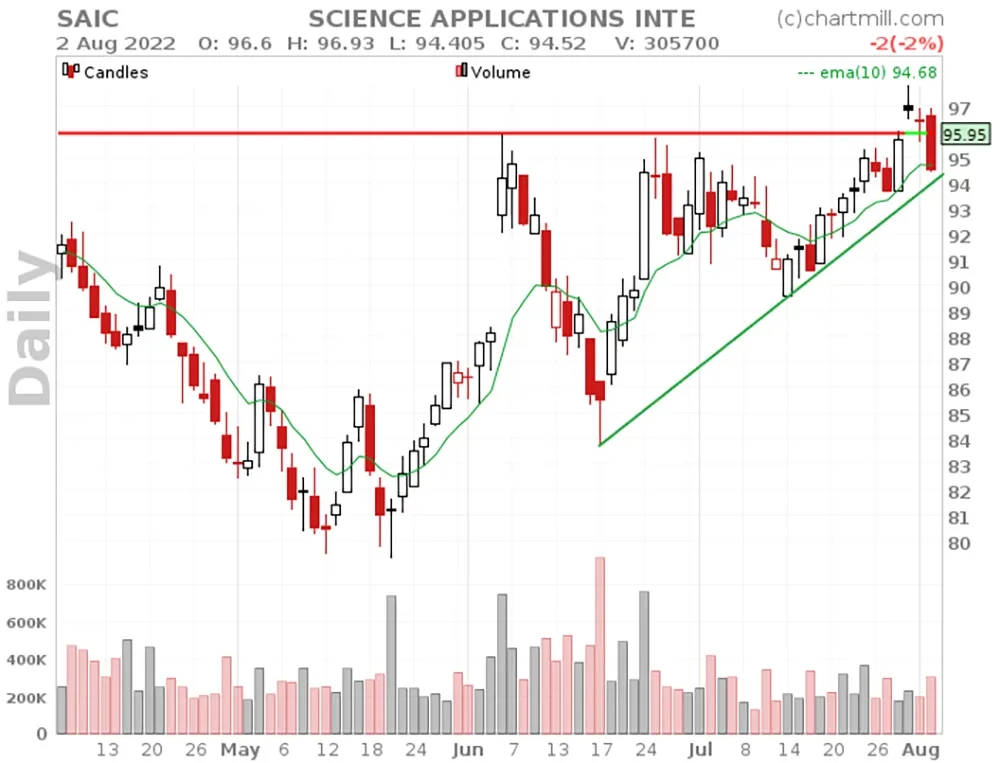
The charts of both stocks are showing a price breakout that occurred a few days ago above horizontal resistance. However, this happened with relatively little momentum and the volume was also underwhelming. Typical features on which you should not withhold such breakouts as a setup...
The latest candle completely nullifies the breakout move, seller volume is also slightly higher and the candle itself is explicitly bearish. On both charts the price has fallen back below the SMA10. As soon as the price also drops below the rising green trend line, you are dealing with a solid shortsetup where the stoploss can be placed above the existing high.
Fan of this screen? We've added a screenfilter to our trading ideas page.
If you want to save this screen click on the diskette icon and choose a name. You can now open the screen at any time with just one click.
In addition to this blog article, a vidoe is also available. You can watch it via this link.
Trade Safe!
