Mean Reversion Screens - Failed Breakouts above 52 week High
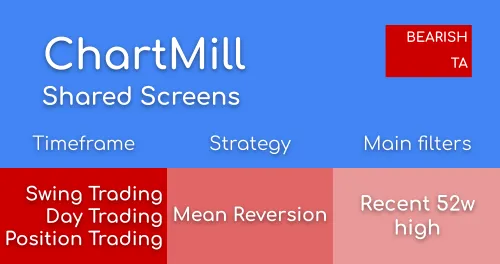
This screen looks for stocks that have broken through their 52-week high within the past five days but have fallen more than 2% on the most recent trading day while closing lower than the previous trading day's low. In addition, the previous trading day must have ended positively.

Mean Reversion Stock Screener
Use the stock screener to find mean reversion trading ideas
Related Videos
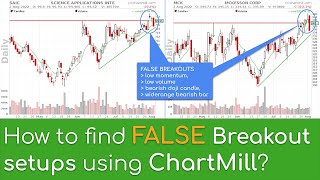
How to find failed breakoutsetups using ChartMill? (So you can short them)
Trading price breakouts is a well-known technique from technical analysis which is mainly used by price action traders. The breakout strategy can be very profitable if you manage to focus only on the very best setups. But the same is true if you now how to short breakoutsetups that fail... In this video i use the ChartMill stock screener to find those failed breakoutsetups and i will provide some tips about the entry conditions.
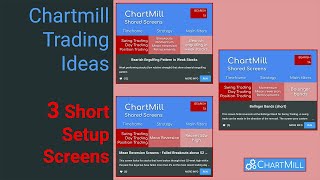
3 ChartMill Trading Ideas To Find Decent Short Setups
In this video, I share 3 ChartMill Trading Ideas to find good short setups. Please note that this is in no way a recommendation to sell stocks short.
Signal: New 52 week High in last 5 days
Only stocks that reached a new 52 week high in the last 5 days
Today<=-2%
This filters for stocks moving at least 2% down today
Price: Above 5
A minimum price
(previousClose>previousOpen)
Previous day closed positive
(close<previousLow)
Current close must be lower than the previous low
Average Volume: 50 SMA > 300K
Minimal liquidity
SMA10 and SMA20 visible on the chart
Regional Run
Run this screen in your favorite region. You can always further fine tune the screen by changing the general settings after it opened in the screener.