
Anyone who uses technical analysis as an investor to determine entry and exit points will undoubtedly have already heard of moving averages. These are mainly used to determine the trend in the short, medium and long term. The moving average shows the average price over a number of set periods and thus ensures that temporary extreme price movements are averaged out.
A distinction is made between:
-
The SMA is the most basic type and simply calculates the average price of a set of prices over a period of time. If you want to calculate the SMA over a period of 10 days, take the values of the last 10 days and divide the result by 10.
-
The EMA, the exponential moving average, gives more weight to recent prices than a simple moving average. The value of the EMA will therefore be more influenced by the more recent values.
-
The Smoothed Moving Average (SMMA) is a combination of a SMA and an EMA. It gives the recent prices an equal weighting as the historic prices as it takes all available price data into account.
More detailed information is available through the links above. In this topic we discuss the most popular average periods for swing trading based on the daily chart. These are the 20, 50 and 200SMA.
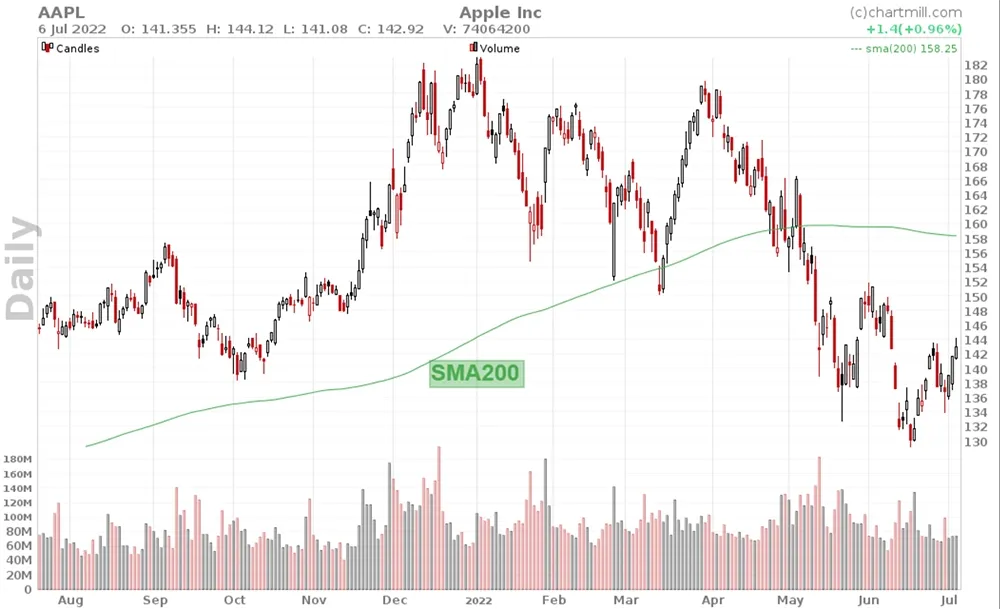
The 200SMA (Long Term Trend)
The 200SMA is a commonly used moving average for determining the long-term trend. The easiest way to do this is by simply looking at the current price. If it is above the 200-day average, the long-term trend is considered bullish. In case the price is trading below the 200SMA the trend is bearish.
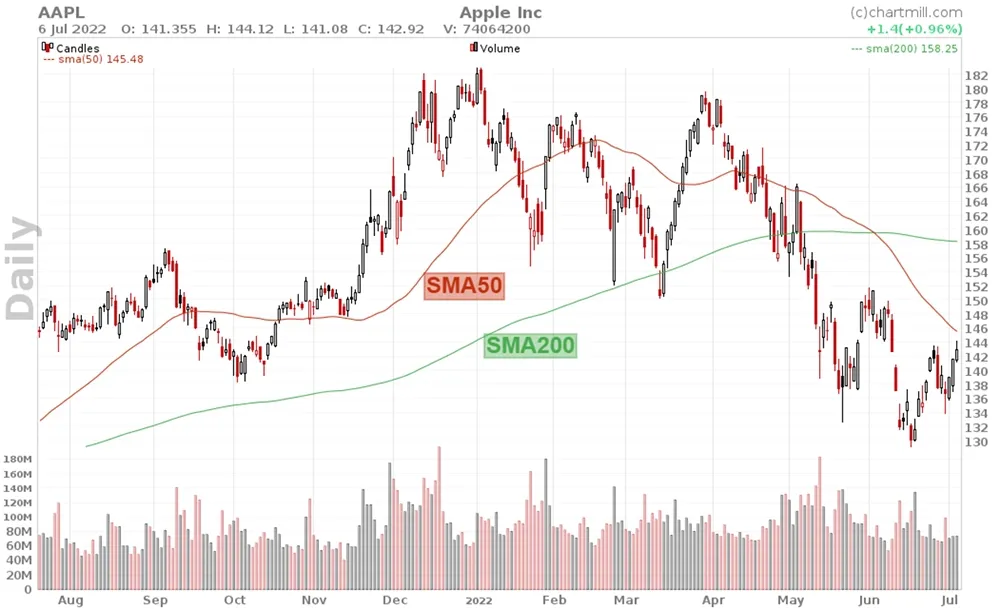
Another slightly more nuanced way consists of combining the 200SMA with the 50SMA. The long-term trend is then determined by the position of the 50SMA relative to the 200SMA. If the 50SMA is higher than the 200SMA, the long-term trend is positive. Otherwise, the trend is negative.
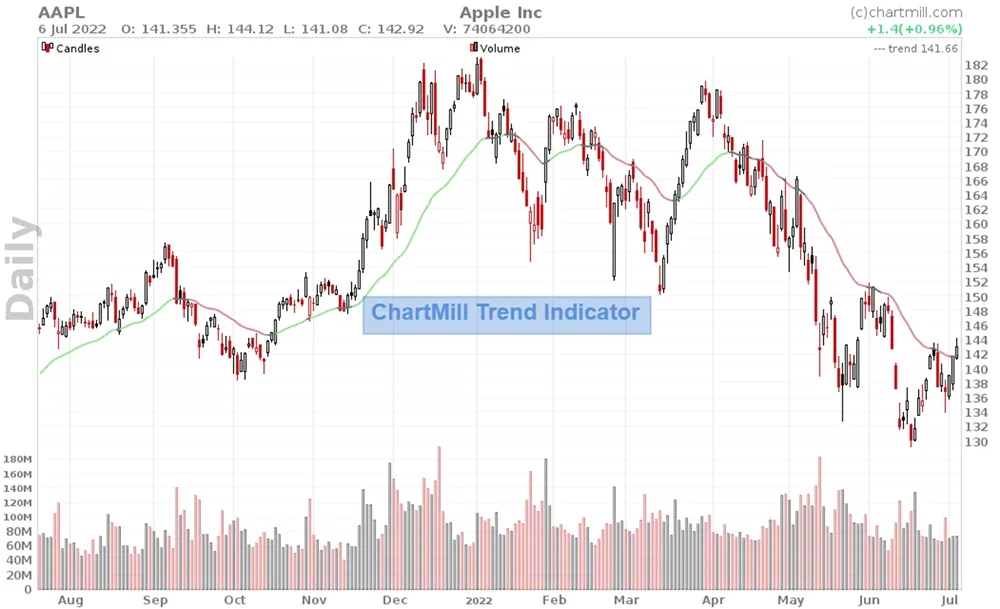
The 200SMA alternative
Finally, for the long-term, you can also use our own ChartMill Trend Indicator. This is based on a 30-week average line and should therefore be applied to a weekly chart. The advantage of the ChartMill Trend Indicator is that it consists of three colors. The indicator turns green if it is bullish, red if it is bearish and gray if it is neutral. It is our favorite indicator to get an indication of the existing long-term trend in just one glance. We use it throughout our market updates.
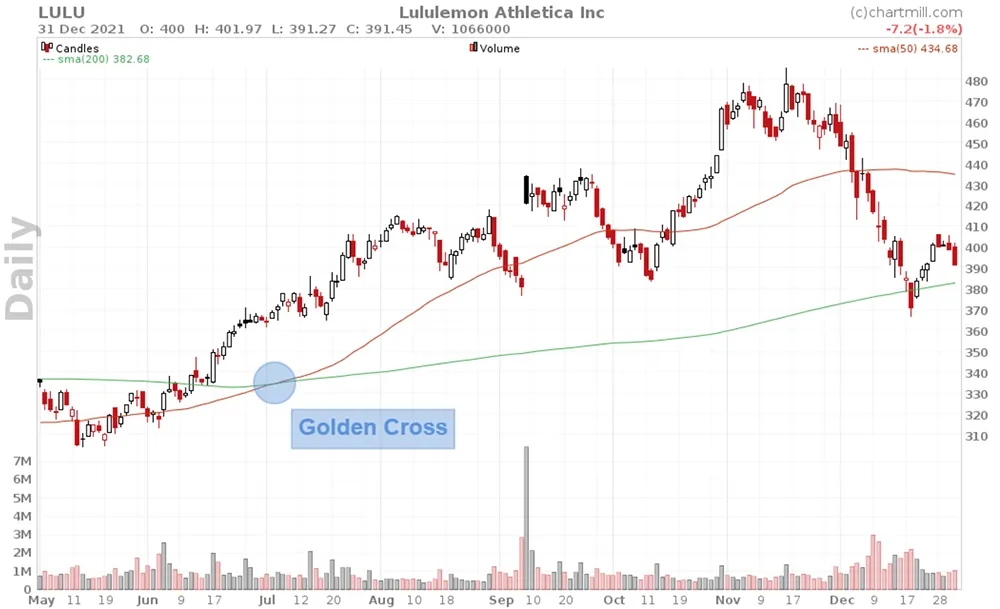
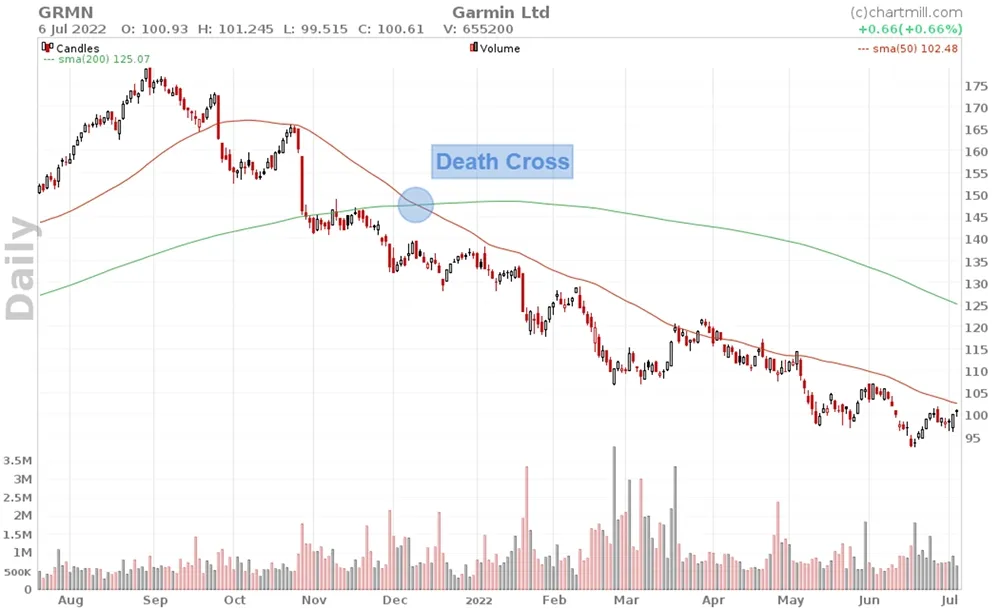
The Golden and Death Cross
The crossings of the 50 with the 200SMA are also known as the Golden and Death cross. The Golden Cross refers to the change in trend from negative to positive as the 50SMA crosses the 200SMA upward. The Death Cross refers to the opposite movement, at the time when the 50SMA crosses the 200SMA down and the trend turns from positive to negative.
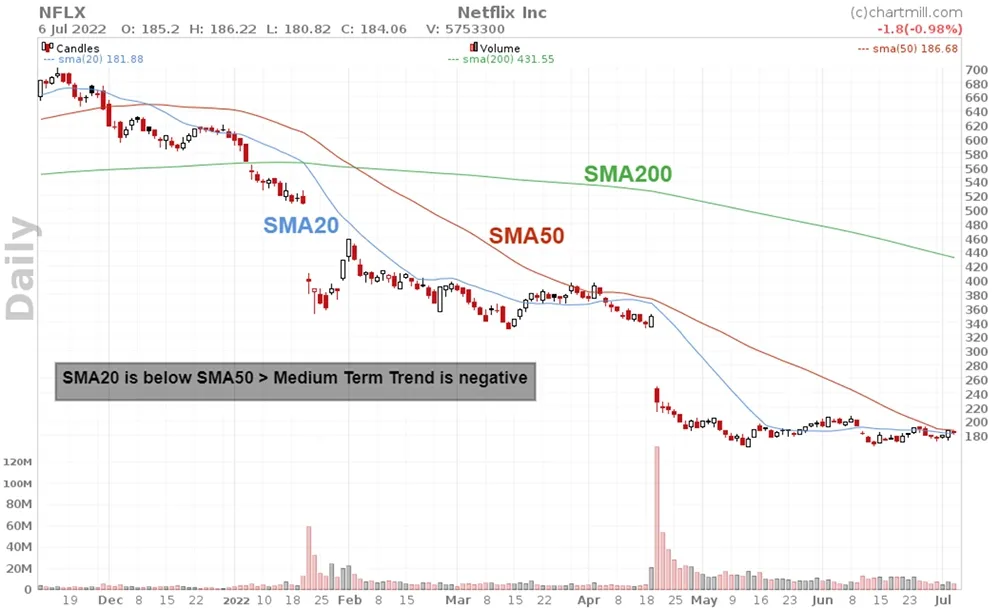
The 20 and 50SMA (Medium Term Trend)
To determine the medium term, a combination of the 20SMA and the 50SMA is often used. In this case the medium term trend is positive if the 20SMA is above the 50SMA and negative if the 50SMA is above the 20SMA.
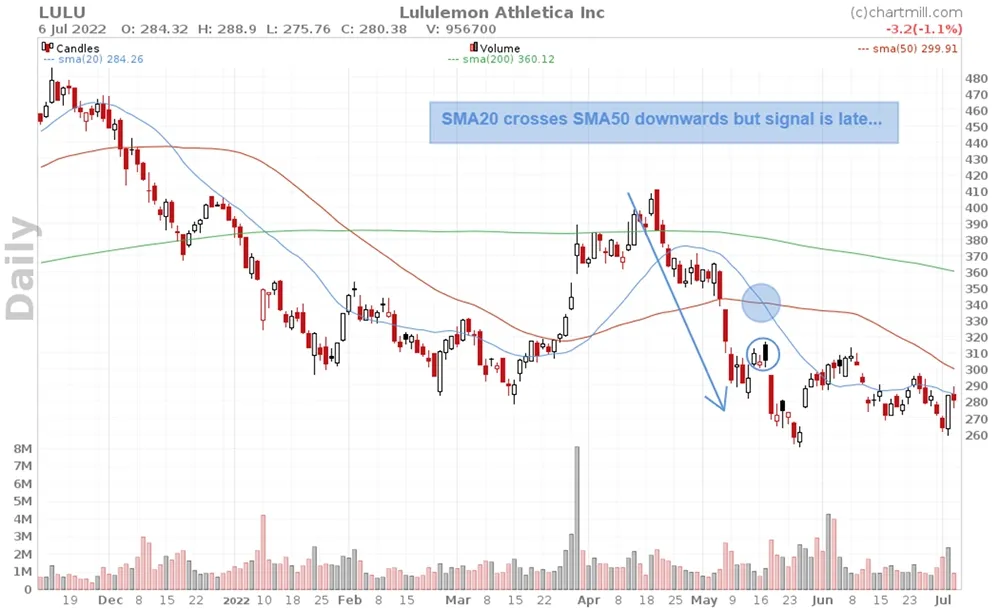
The respective crossing can be used as long- or shortentry when swing trading but keep in mind that in strongly trending markets the signals will occur quite late and the new trend will have already made a significant move.
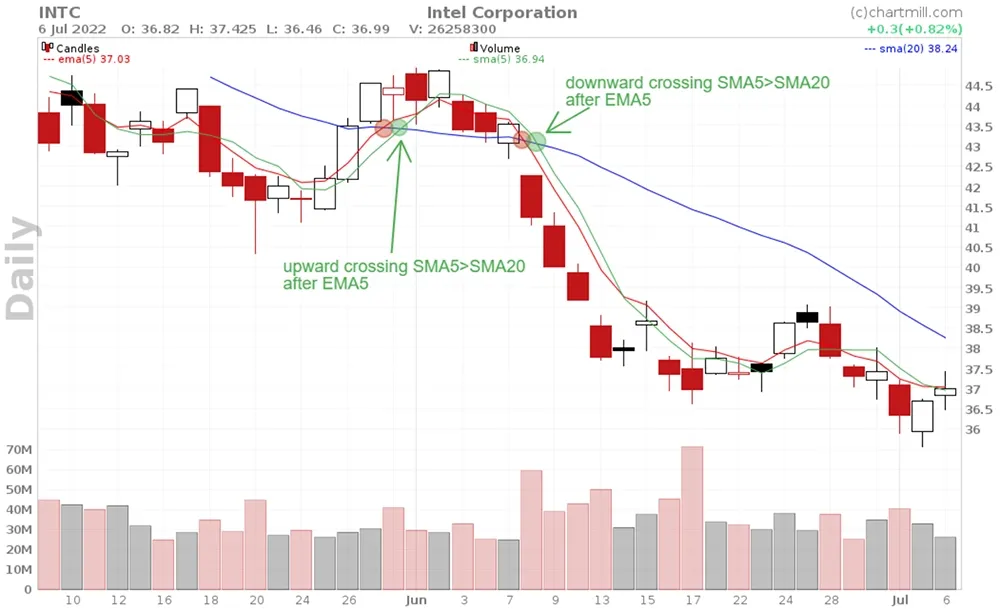
The 20 SMA - combined with the 5EMA or 10EMA (Short Term Trend)
Finally, the 20SMA can be used to determine the short-term trend. It is either combined with the 10EMA or the 5EMA. Which of the two depends purely on your own preference. The shorter 5EMA will - due to the shorter period - obviously react a little more sensitively than the 10EMA. The reason that for both short term averages the EMA and not the SMA version is used is that the EMA version gives a little more weight to the most recent prices so that the crossings of the EMA5 with the 20SMA will take place a little faster.
Although we have used daily charts with these popular averages, they are definitely used in intraday trading as well. In that case, keep in mind that a 50-day average on an hourly chart represents a price based on the last 50 hourly periods. Thus, the value will differ from the same 50SMA on a daily chart.
The ChartMill Team
