
INTL BUSINESS MACHINES CORP (NYSE:IBM) Shows Potential for Technical Breakout
By Mill Chart
Last update:
Technical breakout investing focuses on identifying stocks that are consolidating within a defined range before making a decisive move higher. Traders look for strong technical setups where a stock has built a base and is poised to break out, offering a favorable risk-reward opportunity. INTL BUSINESS MACHINES CORP (NYSE:IBM) currently presents such a setup, with a solid technical foundation and a promising consolidation pattern.
Technical Overview
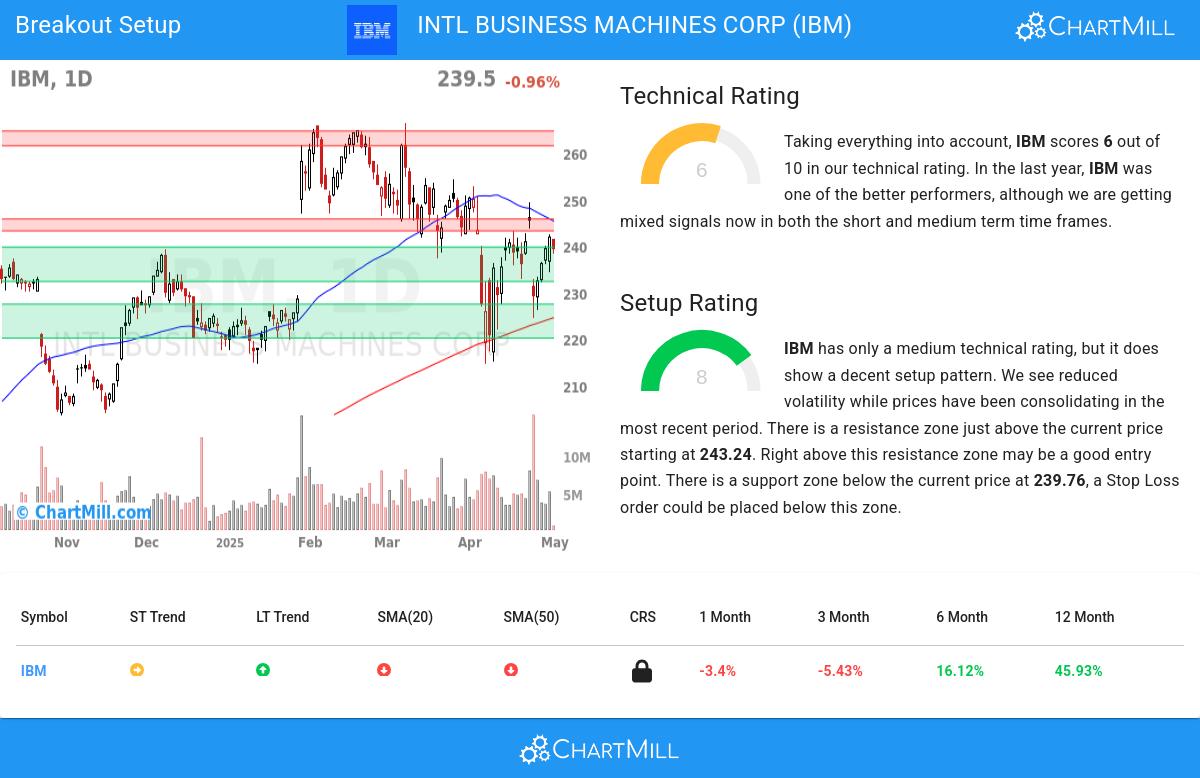
IBM has a Technical Rating of 6, indicating a mixed but still constructive trend. The long-term trend remains positive, while the short-term trend is neutral. The stock has outperformed 91% of the market over the past year and ranks well within its industry, beating 77% of IT Services stocks.
The Setup Rating of 8 suggests a strong consolidation pattern. Recent price action has been contained within a range, with reduced volatility, which often precedes a breakout. Key support lies between 232.35 and 237.91, while resistance sits between 239.76 and 245.81. A decisive move above 245.82 could signal the start of a new upward leg.
Key Takeaways from the TA Report
- Relative Strength: IBM has shown strong performance compared to the broader market and its sector.
- Consolidation Phase: The stock has been trading in a tight range, forming a potential base for a breakout.
- Support & Resistance Levels: Clear zones provide defined entry and exit points for traders.
- Volume & Liquidity: Average daily volume of 5.2 million shares ensures good liquidity.
For a deeper analysis, review the full Technical Report.
Trading Considerations
A breakout above 245.82 could serve as an entry point, with a stop-loss placed below 232.34 to manage risk. The potential downside is limited to 5.48%, making this a controlled trade setup.
For more breakout opportunities, check the Technical Breakout Screen.
