Despite its growth, VERTIV HOLDINGS CO-A (NYSE:VRT) remains within the realm of affordability.
By Mill Chart
Last update: May 2, 2025
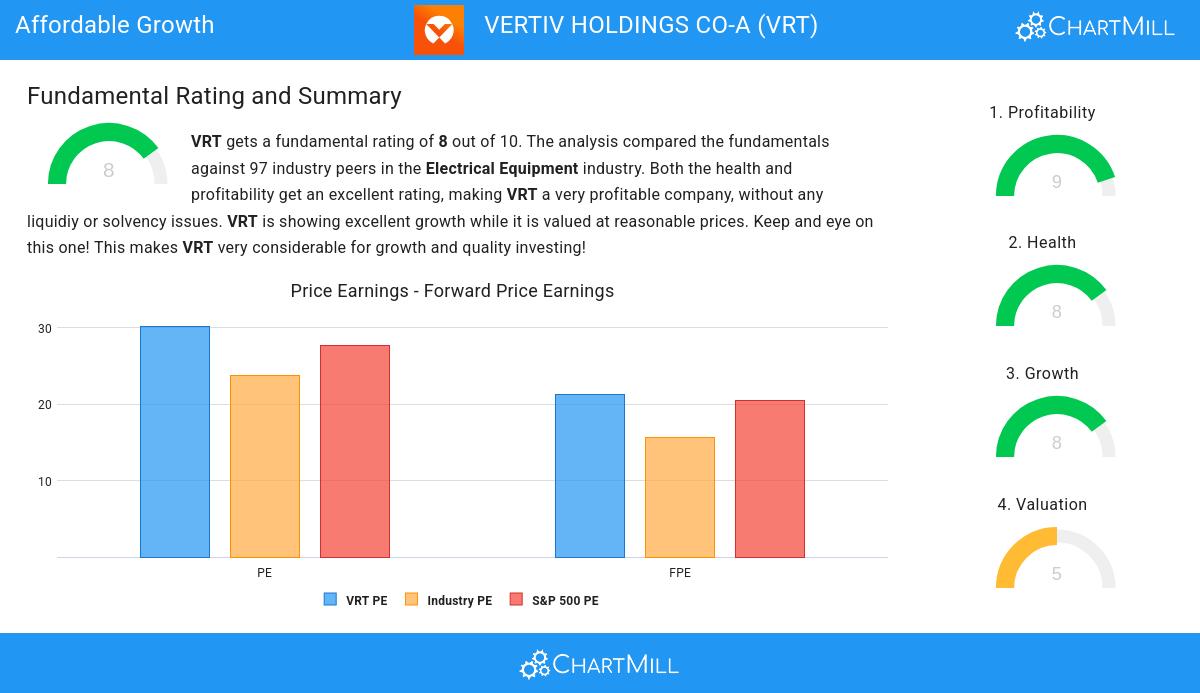
Here's VERTIV HOLDINGS CO-A (NYSE:VRT) for you, a growth stock our stock screener believes is undervalued. VRT is scoring impressively in terms of growth while demonstrating strong financials. On top of that, it remains attractively priced. Let's break it down further.
Growth Analysis for VRT
ChartMill assigns a Growth Rating to each stock, ranging from 0 to 10. This rating is determined by analyzing different growth elements, including EPS and revenue growth, spanning both historical and future figures. In the case of VRT, the assigned 8 reflects its growth potential:
- VRT shows a strong growth in Earnings Per Share. In the last year, the EPS has been growing by 55.33%, which is quite impressive.
- VRT shows a strong growth in Earnings Per Share. Measured over the last years, the EPS has been growing by 55.36% yearly.
- The Revenue has grown by 20.45% in the past year. This is a very strong growth!
- The Revenue has been growing by 12.57% on average over the past years. This is quite good.
- The Earnings Per Share is expected to grow by 19.62% on average over the next years. This is quite good.
- VRT is expected to show quite a strong growth in Revenue. In the coming years, the Revenue will grow by 12.85% yearly.
A Closer Look at Valuation for VRT
ChartMill assigns a Valuation Rating to every stock. This score ranges from 0 to 10 and evaluates the different valuation aspects and compares the price to earnings and cash flows, while taking into account profitability and growth. VRT scores a 5 out of 10:
- 71.13% of the companies in the same industry are more expensive than VRT, based on the Price/Earnings ratio.
- Based on the Price/Forward Earnings ratio, VRT is valued a bit cheaper than the industry average as 72.16% of the companies are valued more expensively.
- Based on the Enterprise Value to EBITDA ratio, VRT is valued a bit cheaper than 73.20% of the companies in the same industry.
- VRT's Price/Free Cash Flow ratio is a bit cheaper when compared to the industry. VRT is cheaper than 74.23% of the companies in the same industry.
- VRT has an outstanding profitability rating, which may justify a higher PE ratio.
- VRT's earnings are expected to grow with 23.54% in the coming years. This may justify a more expensive valuation.
Health Examination for VRT
A critical element of ChartMill's stock evaluation is the Health Rating, which spans from 0 to 10. This rating considers multiple health factors, including liquidity and solvency, both in absolute terms and relative to industry peers. VRT has received a 8 out of 10:
- VRT has an Altman-Z score of 4.80. This indicates that VRT is financially healthy and has little risk of bankruptcy at the moment.
- The Altman-Z score of VRT (4.80) is better than 85.57% of its industry peers.
- VRT has a debt to FCF ratio of 2.25. This is a good value and a sign of high solvency as VRT would need 2.25 years to pay back of all of its debts.
- The Debt to FCF ratio of VRT (2.25) is better than 82.47% of its industry peers.
- Even though the debt/equity ratio score it not favorable for VRT, it has very limited outstanding debt, so we won't put too much weight on the DE evaluation.
- The current and quick ratio evaluation for VRT is rather negative, while it does have excellent solvency and profitability. These ratios do not necessarly indicate liquidity issues and need to be evaluated against the specifics of the business.
Understanding VRT's Profitability
ChartMill assigns a Profitability Rating to every stock. This score ranges from 0 to 10 and evaluates the different profitability ratios and margins, both absolutely, but also relative to the industry peers. VRT scores a 9 out of 10:
- Looking at the Return On Assets, with a value of 7.05%, VRT belongs to the top of the industry, outperforming 88.66% of the companies in the same industry.
- The Return On Equity of VRT (24.98%) is better than 94.85% of its industry peers.
- VRT's Return On Invested Capital of 17.71% is amongst the best of the industry. VRT outperforms 95.88% of its industry peers.
- The last Return On Invested Capital (17.71%) for VRT is above the 3 year average (10.93%), which is a sign of increasing profitability.
- VRT's Profit Margin of 7.92% is amongst the best of the industry. VRT outperforms 85.57% of its industry peers.
- VRT's Profit Margin has improved in the last couple of years.
- VRT's Operating Margin of 17.49% is amongst the best of the industry. VRT outperforms 92.78% of its industry peers.
- VRT's Operating Margin has improved in the last couple of years.
- Looking at the Gross Margin, with a value of 36.32%, VRT belongs to the top of the industry, outperforming 81.44% of the companies in the same industry.
- VRT's Gross Margin has improved in the last couple of years.
More Affordable Growth stocks can be found in our Affordable Growth screener.
Our latest full fundamental report of VRT contains the most current fundamental analsysis.
Disclaimer
Important Note: The content of this article is not intended as trading advice. It is essential to perform your own analysis and exercise caution when making trading decisions. The article presents observations created by automated analysis but does not guarantee any trading or investment outcomes. Always trade responsibly and make independent judgments.
95
+2.45 (+2.65%)
Find more stocks in the Stock Screener
VRT Latest News and Analysis
 a day ago - ChartmillDespite its growth, VERTIV HOLDINGS CO-A (NYSE:VRT) remains within the realm of affordability.
VERTIV HOLDINGS CO-A could be undervalued. NYSE:VRT is scoring impressively in terms of growth while demonstrating strong financials. On top of that, it remains attractively priced.
