
VIKING HOLDINGS LTD (NYSE:VIK) has appeared as a notable candidate in our daily technical breakout screen, which finds stocks showing both good basic technical health and positive consolidation patterns. This method, based on ChartMill's own scoring system, measures two key parts: the Technical Rating, which checks a stock's overall trend strength and momentum, and the Setup Quality Rating, which decides if the stock is building a good base that might come before a notable price move. The goal is to find securities that are not only in strong uptrends but also placed at good entry points, lowering risk while increasing possible upside. This two-rating method helps technical investors avoid buying after large moves and instead concentrate on chances where price consolidation gives a defined risk structure.
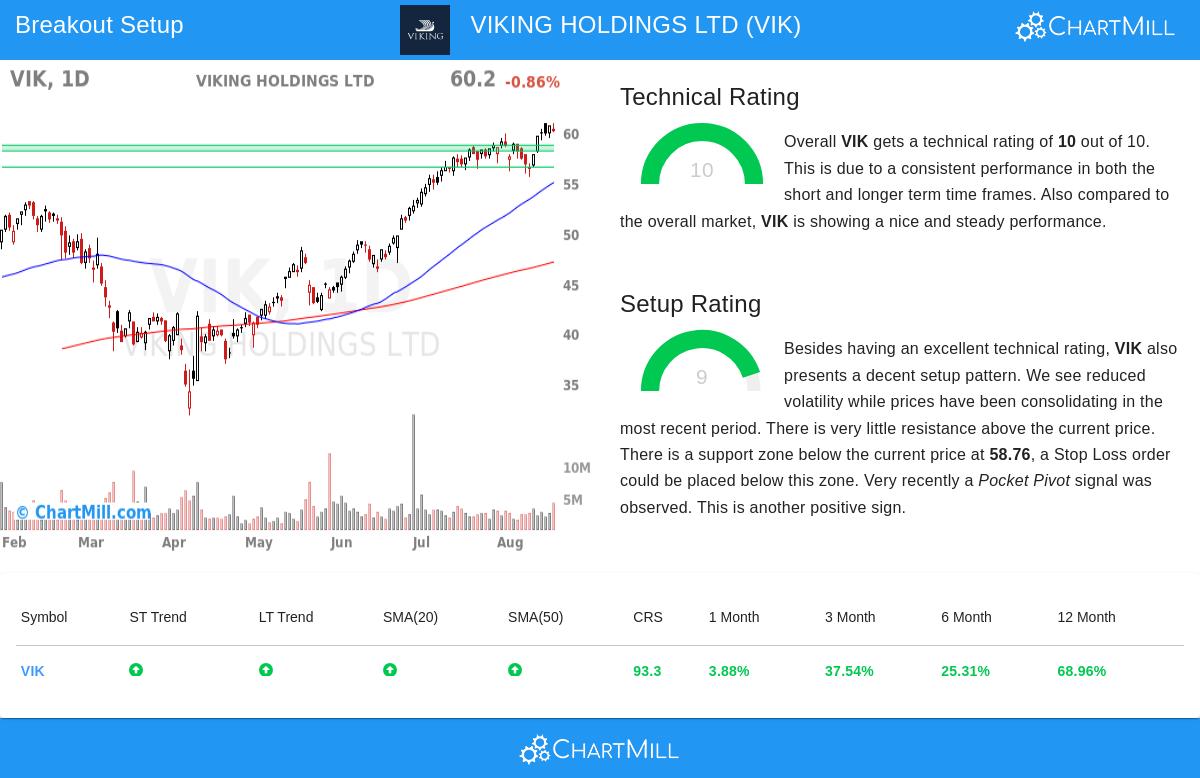
Technical Strength and Momentum VIKING HOLDINGS LTD shows very good technical energy, getting a top Technical Rating of 10. This score shows it is better across many timeframes and technical measures. The stock is trading well above its main moving averages, including the 20-day, 50-day, 100-day, and 200-day SMAs, all of which are rising, confirming continued positive momentum. Both the short-term and long-term trends are clearly positive, an alignment that is not common and frequently a sign of big institutional buying. Furthermore, VIK is doing better than 93% of all stocks in the market on a yearly basis and is in the top 9% of its industry group in the Hotels, Restaurants & Leisure sector. Such strong relative performance is a mark of market leadership and is a key filter in the breakout screen, as it helps find stocks with the greatest chance of continuing their upward path.
Setup Quality and Consolidation Pattern Adding to its excellent technical rating, VIK has a Setup Quality Rating of 9, indicating a high-grade consolidation pattern that often comes before a breakout. The stock has been trading inside a set range between about $55.55 and $60.97 over the last month, showing lower volatility and narrow price action, a classic signal of balance between buyers and sellers. This consolidation has built a firm support area between $58.19 and $58.76, made by a combination of trendlines and moving averages, which gives a sensible level for setting protective stop-loss orders. Additionally, the recent showing of a Pocket Pivot signal, where price increases on volume greater than the highest down volume of the previous ten days, hints at basic buying without notable selling pressure. These factors are vital for the strategy, as they make sure the setup gives a positive risk/reward profile, with a defined entry point above the recent range and a clear exit level below support.
Risk Management and Trade Structure The technical report describes a sample trade setup using these ratings, suggesting an entry at $60.98 (just above the 10-day high) and a stop-loss at $58.18 (below the support area). This structure caps the possible loss to 4.59% of the trade value, allowing for exact position sizing. For investors controlling a 1% total portfolio risk, the setup indicates putting up to 21.78% of capital into this chance. It is important to see that while the automated setup is bold, it highlights the need to use stops and change the settings to personal risk tolerance. The stock’s average true range (ATR) of about 2.28% shows medium daily volatility, which should be included in any trading plan.
For those wanting to look into similar technical breakout chances, our daily updated Technical Breakout Setups screen offers a selected list of stocks meeting these strict criteria. This tool is made to save time for investors by pointing out the most encouraging setups each trading day.
Disclaimer: This analysis is for informational purposes only and does not constitute investment advice. All trading decisions should be based on individual research and risk assessment. Past performance is not indicative of future results.