
Technical analysis investors often look for stocks showing both good basic momentum and clear consolidation patterns that indicate possible breakout chances. This method uses two special ChartMill indicators: the Technical Rating, which assesses a stock's general technical condition and trend power, and the Setup Quality Rating, which finds consolidation patterns that might come before notable price changes. Stocks with high scores on both measures offer what technical traders see as good situations for breakout trading plans.
Technical Strength Assessment
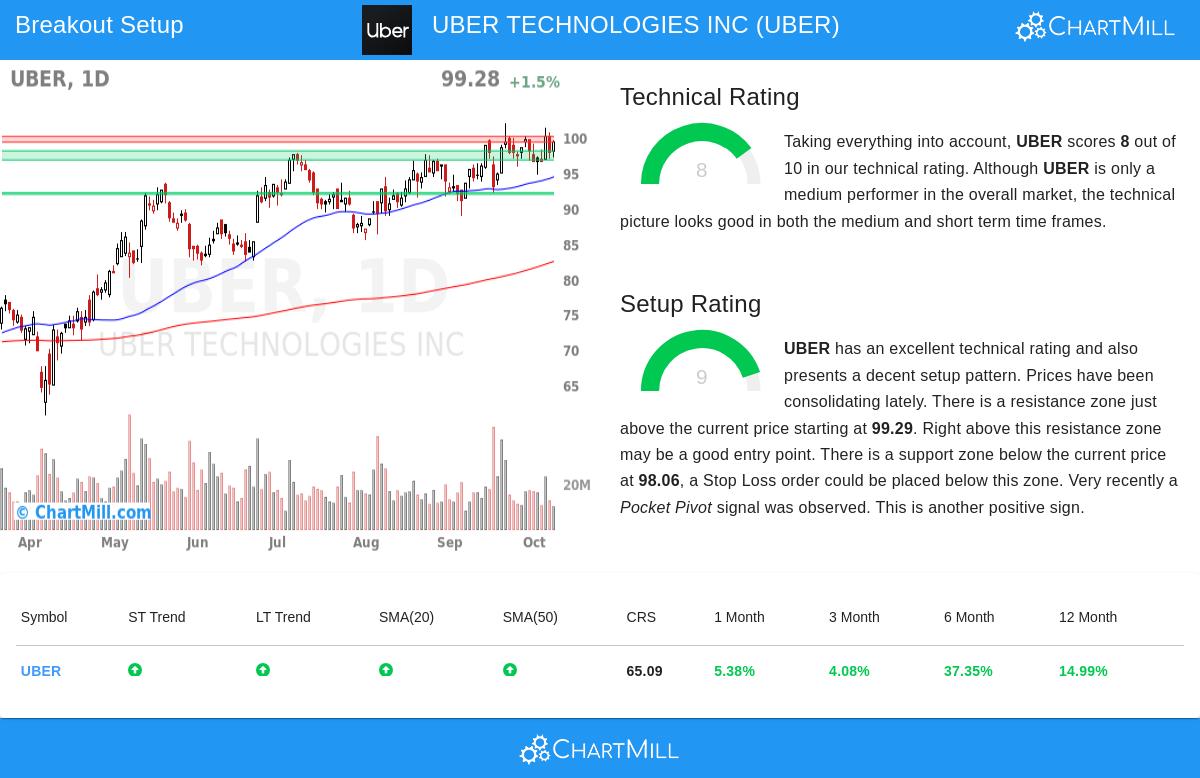
Uber Technologies Inc (NYSE:UBER) shows good technical features based on the ChartMill Technical Analysis report, getting a Technical Rating of 8 out of 10. This high rating points to several good technical elements that match the method's focus on finding stocks with clear upward momentum.
Important technical positives are:
- Both long-term and short-term trends are good, showing matching momentum across different periods
- The stock price is close to its 52-week high of $101.99, indicating continued upward push
- All main moving averages (20, 50, 100, and 200-day) are going up and are below the present price
- Relative performance in the Ground Transportation industry has UBER doing better than 80% of similar companies
The Technical Rating matters because it can find stocks with clear upward momentum, which is the base for good breakout trading. Stocks with ratings over 7 usually show the continued buying interest and trend steadiness that technical traders want before thinking about entry points.
Setup Quality and Consolidation Pattern
UBER's Setup Rating of 9 out of 10 shows a very good consolidation pattern that technical traders search for when spotting possible breakout candidates. The setup study shows a clear trading range that has formed over the last month, creating the base for a possible upward move.
Notable setup features are:
- Recent trading between $92.12 and $101.99, with present price action showing consolidation
- A clear resistance area between $99.29 and $100.10
- Several support levels found below the present price, giving sensible stop-loss placement options
- A recent Pocket Pivot signal showing institutional buying
The Setup Quality Rating is important because it can find times of price consolidation that often come before big moves. High setup scores indicate the stock has formed a base where supply and demand are balanced, possibly leading to large moves when one side takes control. For breakout traders, these consolidation phases give clear points for entry triggers and risk control.
Trading Considerations
The technical analysis indicates a possible breakout setup with particular price levels traders could watch. The resistance area just above present prices gives a sensible trigger point, while the support structure below offers several areas for stop-loss placement.
Important trading factors to note:
- A breakout entry could be thought about above $100.11, meaning a move through resistance
- Support areas are at $96.77-$98.06, $91.93-$92.13, and $86.91 for possible stop-loss placement
- The 3.35% space between suggested entry and exit points means acceptable risk
- Average daily volume of 17.67 million shares gives enough liquidity
While the technical view looks good, traders should know the setup is happening as the S&P 500 trades near record highs, creating possible connection risks. Also, the fairly close stop-loss distance compared to UBER's average true range of 2.79 points might need careful position sizing to handle price swings.
Finding Additional Opportunities
The Technical Breakout Setups method that found UBER can be used to find other similar chances in the market. For investors looking for more possible breakout candidates, the Technical Breakout Setups screen regularly updates with stocks showing both good technical ratings and high setup quality scores.
Disclaimer: This analysis is based on technical indicators and pattern recognition and should not be considered investment advice. All trading and investment decisions involve risk, and individuals should conduct their own research and consult with financial advisors before making investment decisions. Past performance does not guarantee future results.