Technical breakout strategies aim to identify stocks with strong underlying momentum that are consolidating in preparation for their next upward move. This approach combines two critical elements: a solid technical foundation indicating the stock is in a sustainable uptrend, and a high-quality setup showing recent price consolidation that provides a clear entry point with defined risk management levels. By focusing on stocks that exhibit both characteristics, investors seek to participate in the most dynamic phase of a stock's advance while maintaining disciplined risk control through precise entry and stop-loss levels.
UBER TECHNOLOGIES INC (NYSE:UBER) demonstrates notable characteristics that align with this technical breakout methodology. The ride-hailing and delivery platform shows strong technical health combined with a consolidation pattern that suggests potential for continued upward movement.
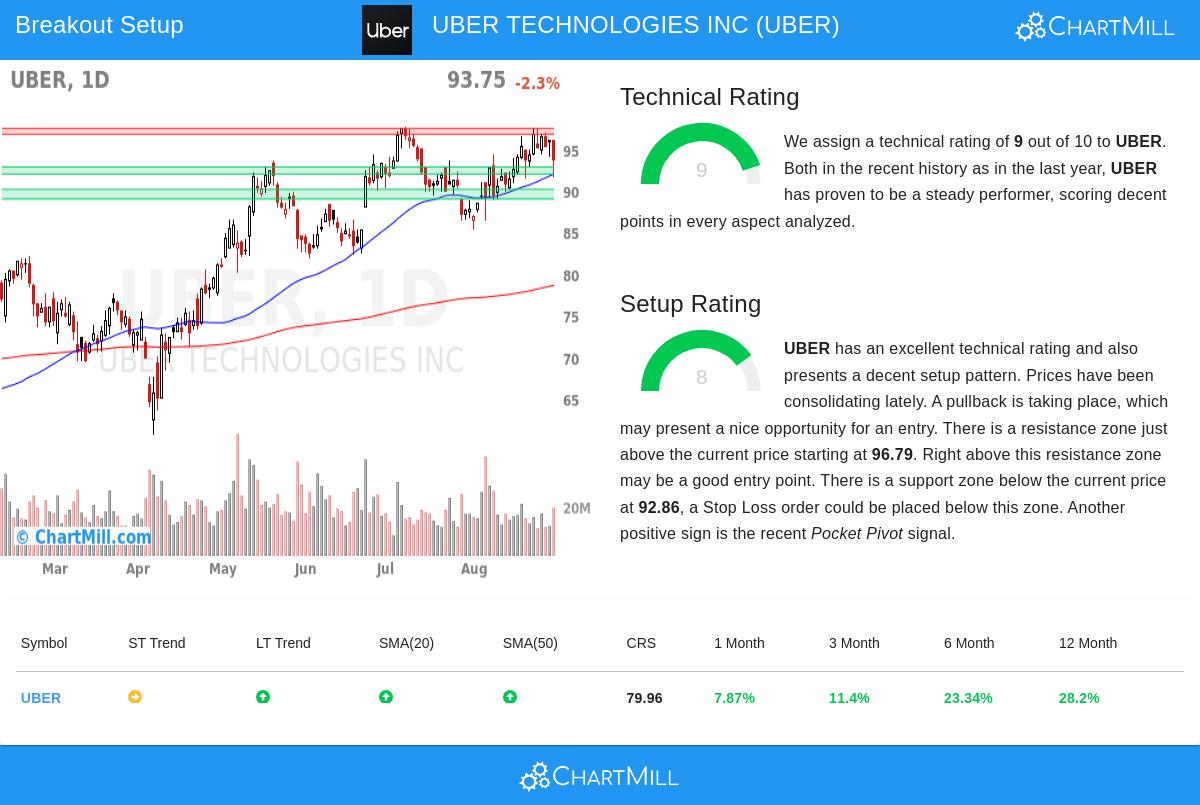
Technical Strength and Momentum
- The stock earns an impressive technical rating of 9 out of 10, indicating superior technical health relative to the broader market. This high rating reflects UBER's strong position within its industry group, where it performs better than 85% of other ground transportation stocks
- Long-term trend analysis reveals a consistently positive trajectory, with the stock trading near its 52-week high of $97.715 while maintaining support above all major moving averages (20-day: $92.86, 50-day: $92.00, 100-day: $87.27, 200-day: $78.63)
- Relative strength metrics show UBER has delivered a 28.2% gain over the past year, performing better than 79% of all stocks in the market. This performance has been evenly distributed across the period, suggesting sustainable momentum rather than short-term speculation
Setup Quality and Consolidation Pattern
- With a setup rating of 8 out of 10, UBER presents a high-quality consolidation pattern that has developed over recent weeks. The stock has been trading within a defined range between $86.30 and $97.54, with current price action situated in the middle of this range
- The consolidation phase has created multiple support zones, with the most significant support ranging from $92.00 to $92.86. This zone combines multiple trendlines and moving averages across different timeframes, providing a solid foundation for potential upward movement
- A recent pocket pivot signal, where price advanced on volume exceeding the maximum down volume of the previous ten days, indicates institutional accumulation during this consolidation phase. This pattern often comes before significant breakouts as larger players establish positions
- Resistance is identified between $96.79 and $97.48, creating a clear breakout level that, if surpassed, could signal the next leg higher
Risk Management Considerations The technical analysis suggests a potential trading setup with an entry point at $97.49 (just above resistance) and a stop-loss at $91.99 (below support), representing a risk of approximately 5.6% on the trade. For investors managing a 1% portfolio risk, this translates to allocating approximately 17.7% of capital to this position. The Average True Range of 3.07% indicates normal volatility for a stock of this profile, providing reasonable expectations for price movement.
The combination of strong technical ratings and high-quality setup patterns makes UBER an interesting candidate for technical investors following breakout strategies. The stock's position within a growing industry, combined with clear technical levels, provides a framework for potential opportunity with defined risk parameters.
For investors seeking additional technical breakout opportunities, the Technical Breakout Setups screen regularly identifies stocks meeting similar criteria across various sectors and market capitalizations.
Disclaimer: This analysis is based on technical indicators and historical price patterns and should not be considered investment advice. All investments carry risk, and past performance does not guarantee future results. Investors should conduct their own research and consider their risk tolerance before making any investment decisions.