Taiwan Semiconductor (NYSE:TSM) Stock: A CANSLIM Analysis of a Market Leader
By Mill Chart
Last update: Aug 20, 2025
For investors looking for high-growth opportunities, the CANSLIM methodology created by William O’Neil provides a systematic way to find market leaders with solid momentum. This method uses both fundamental and technical analysis to find stocks showing strong earnings growth, increasing revenue, notable institutional support, and positive chart patterns. The aim is to find stocks starting a major price increase, preferably during wide market advances.
Taiwan Semiconductor Manufacturing Co., Ltd. (NYSE:TSM) appears as a notable candidate according to a CANSLIM-focused screen. The company, a worldwide leader in semiconductor manufacturing, shows multiple features that match the system’s main ideas.
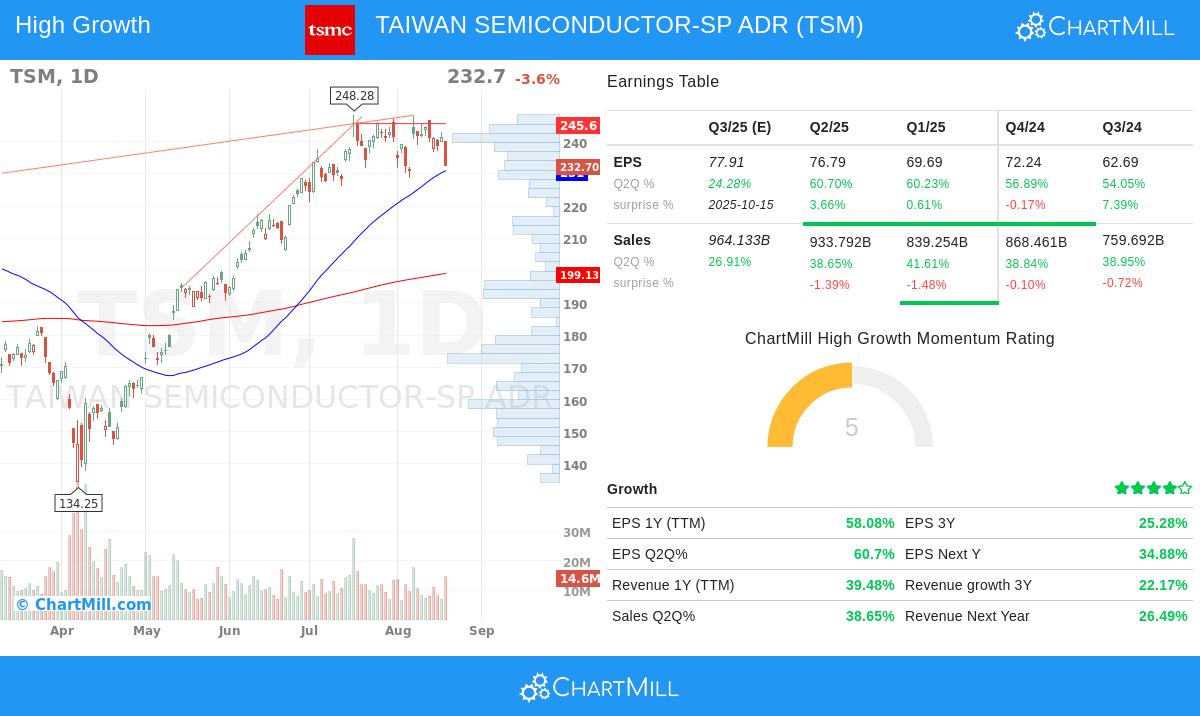
C – Current Quarterly Earnings and Sales Growth A key part of the CANSLIM system is finding companies with very strong recent quarterly results. TSM performs well here, reporting earnings per share growth of 60.70% and sales growth of 38.65% versus the same quarter last year. This is much higher than the method’s usual minimum of 20-25% and shows solid operational speed, a main factor for growth investors looking for companies in a growth period.
A – Annual Earnings Increases In addition to one good quarter, CANSLIM needs a history of growth. TSM’s three-year EPS compound annual growth rate of 25.28% shows a continued ability to raise profitability, easily meeting the method’s standard. Also, the company’s return on equity (ROE) is a notable 31.87%, much higher than the minimum 10% that is often wanted. A high ROE is an important sign of management’s effectiveness in creating profits from shareholder equity.
N – New Products, New Highs Although “newness” can be subjective, TSM’s position at the front of advanced process technology (including its top 3nm and upcoming 2nm nodes) represents this idea. From a technical view, the stock has been trading near the top of its 52-week range, a feature CANSLIM investors want as it implies the market is acknowledging the company’s fundamental strength.
S – Supply and Demand The method prefers companies with a good financial setup. TSM’s debt-to-equity ratio of 0.19 is very low, showing little use of debt financing and a solid balance sheet. This adds to financial steadiness and lowers risk, which is important when investing in growth stocks.
L – Leader or Laggard Relative strength is a key technical filter in CANSLIM, used to confirm a stock is doing better than the wider market. TSM’s relative strength rating of 87.38 means it is performing better than almost 90% of all stocks, confirming its position as a definite market leader, a required feature for this method.
I – Institutional Sponsorship CANSLIM suggests investing with institutional players but before ownership gets too crowded. With institutional ownership at 34.52%, TSM is well under the usual warning level of 85%. This implies there is plenty of space for more institutional buying, which might add more upward push on the stock price.
M – Market Direction The method stresses the need to match stock choices with the general market direction. Right now, both the short and long-term trends for the S&P 500 are up, making a good setting for using CANSLIM-based investments.
A look at TSM’s fundamental analysis confirms its very good profitability and solid growth measures, although it mentions a high valuation. The technical analysis gives the stock a high rating, emphasizing its solid long-term upward trend and leader status, while noting it is now moving within a range, which could offer a possible entry point.
For investors wanting to find other companies that match this high-growth outline, the predefined CANSLIM stock screener offers a solid beginning for more study.
Disclaimer: This article is for informational purposes only and does not constitute investment advice, a recommendation, or an offer to buy or sell any securities. Investors should conduct their own research and consider their individual financial circumstances before making any investment decisions.
298.25
+3.29 (+1.12%)
Find more stocks in the Stock Screener
TSM Latest News and Analysis